Analysis of International Football Matches Between 1872 and 2018 (More than 40,000 Matches)

In this post, I will present the results of a thorough analysis of international football matches that took place between 1872 and 2018 (147 years).
International matches means matches between national teams like Brazil, Italy, Japan, Egypt, etc.
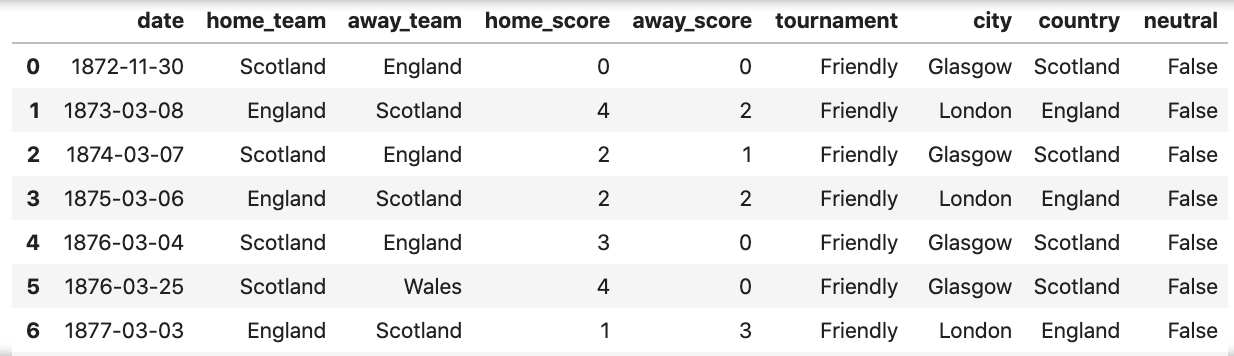
The analysis uses a dataset published on Kaggle on this link. Each row in the dataset represents a match. For each match, the dataset lists its date, the two teams participating in the match, the result of the match, the tournament، the country that hosted the match, and other info. The figure below shows the first few rows of this dataset.
The dataset owner says that “the matches are strictly men’s full internationals and the data does not include Olympic Games or matches where at least one of the teams was the nation’s B-team, U-23 or a league select team”.
Regarding the tournament column in the dataset, it lists the name of the tournament of the match like “FIFA World Cup” tournament and “UEFA Euro” tournament, or “Friendly” for regular friendly matches.
Importance of the Analysis
This analysis presents interesting results for football lovers around the world especially because it covers 40,000+ international matches over 140+ years. It presents the results using elegant visualizations that summarize thousands of rows of data into one picture.
Goals of the Analysis
The analysis will answer questions including:
- Which team played the largest number of matches throughout history?
- Which team played the largest number of matches in FIFA World Cup?
- Which team achieved more wins than others over the years?
- Which team lost more matches than others over the years?
- Which team scored the largest number of goals throughout history?
- Which team scored the largest number of goals in FIFA World Cup?
- Which teams played against each other the most?
- Do Friendly Matches Have Less or More Goals than Non-Friendly Matches?
- In which tournament players tend to score more goals?
- What’s the percentage of matches that ended in draw?
- What is the number of matches played in each tournament throughout history?
- How does the number of matches change through years? Did the 1990s have more matches than the 1980s?
- Which month through history had more matches? Is it June, August, or others? Does the number of matches actually differ from month to month?
- Which day of the week had more matches through history? Did most matches occur in weekends?
Technologies Used to Do the Analysis
The analysis was performed using Python programming language; Pandas package was used to read, handle, and analyze the data; Matplotlib and Seaborn packages were used to produce the visualizations; other packages were used as well. And the whole analysis was done in Jupyter Lab.
Code of the Analysis
The whole analysis with the code used and with explanations about the operations performed can be found in a Jupyter notebook in this Github repository. Please note that the notebook contains extra analytics that are not presented in this post. So if you want everything, see the notebook.
And now, let’s dive into the analysis results. If you need to see an image in bigger size, right-click on the image and open it in a new tab.
Analysis Results
The results will be presented as visualizations that answer the questions mentioned above.
Which team played the largest number of matches throughout history?
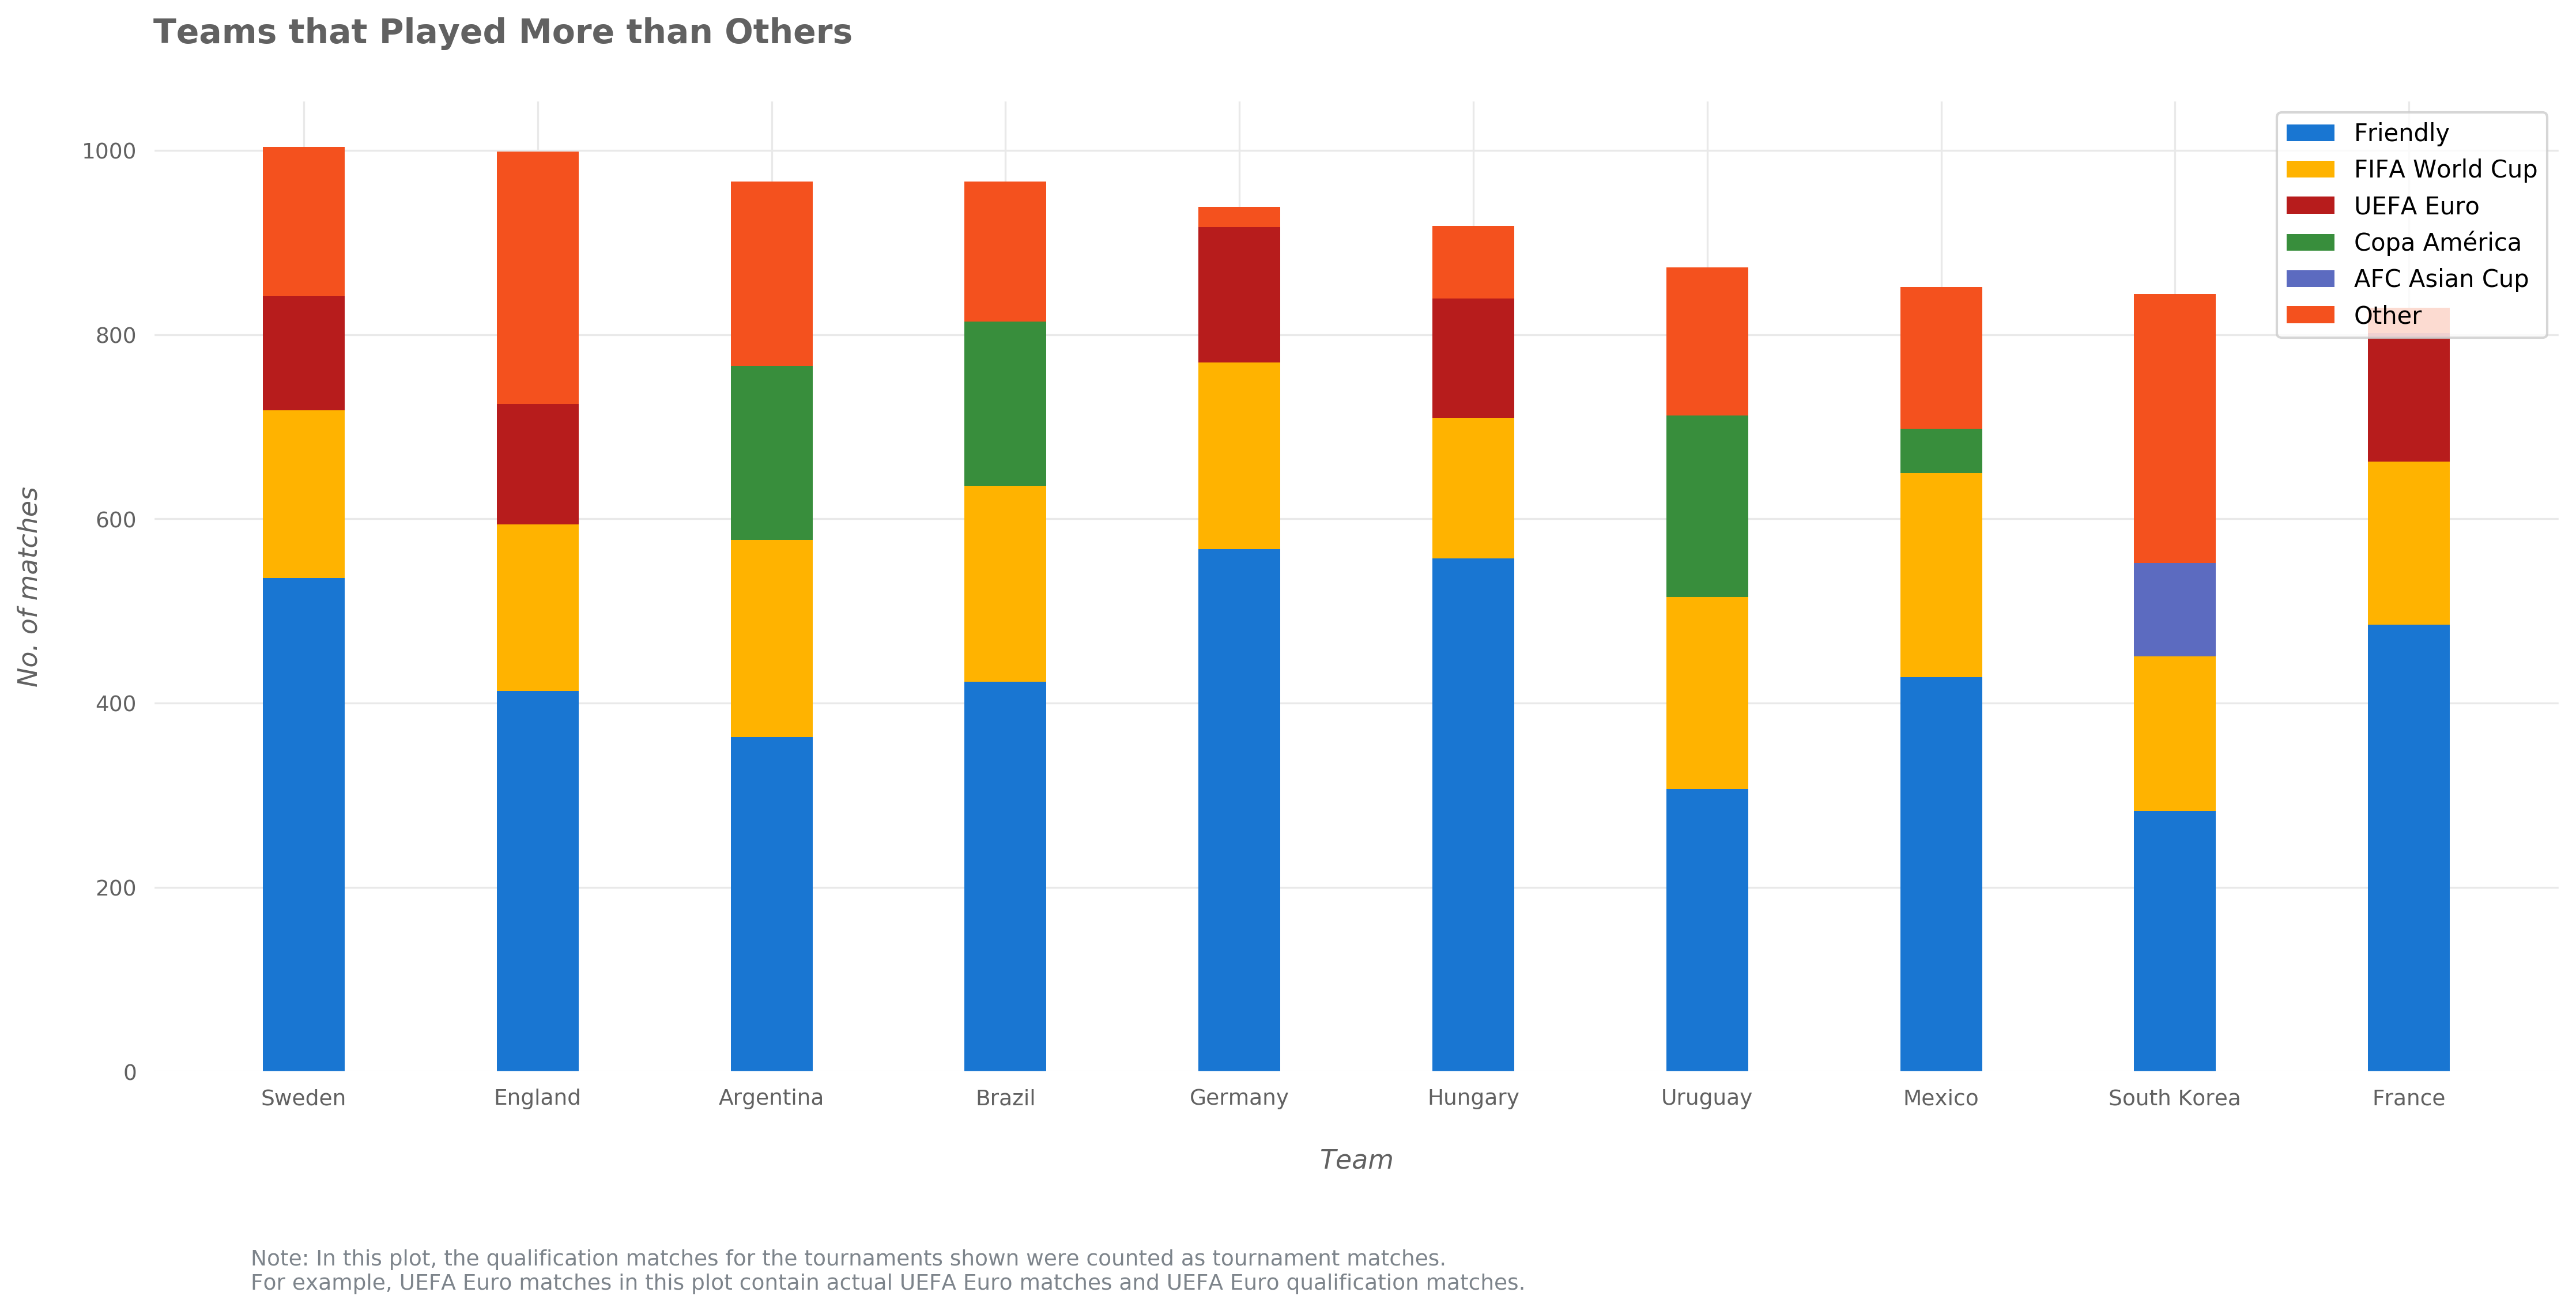
So the answer is Sweden with 1,004 matches followed closely by England with 999 matches followed by both Brazil and Argentina with 966 matches.
This top-10 plot has 5 countries in Europe, 3 countries in South America, 1 country in North America, and 1 country in Asia.
The plot shows also the tournaments played by each of the teams. For example, we can see that most of the matches played by Sweden were friendly matches accompanied by a considerable percentage of matches in FIFA World Cup and UEFA Euro tournaments.
Which team played the largest number of matches in FIFA World Cup?
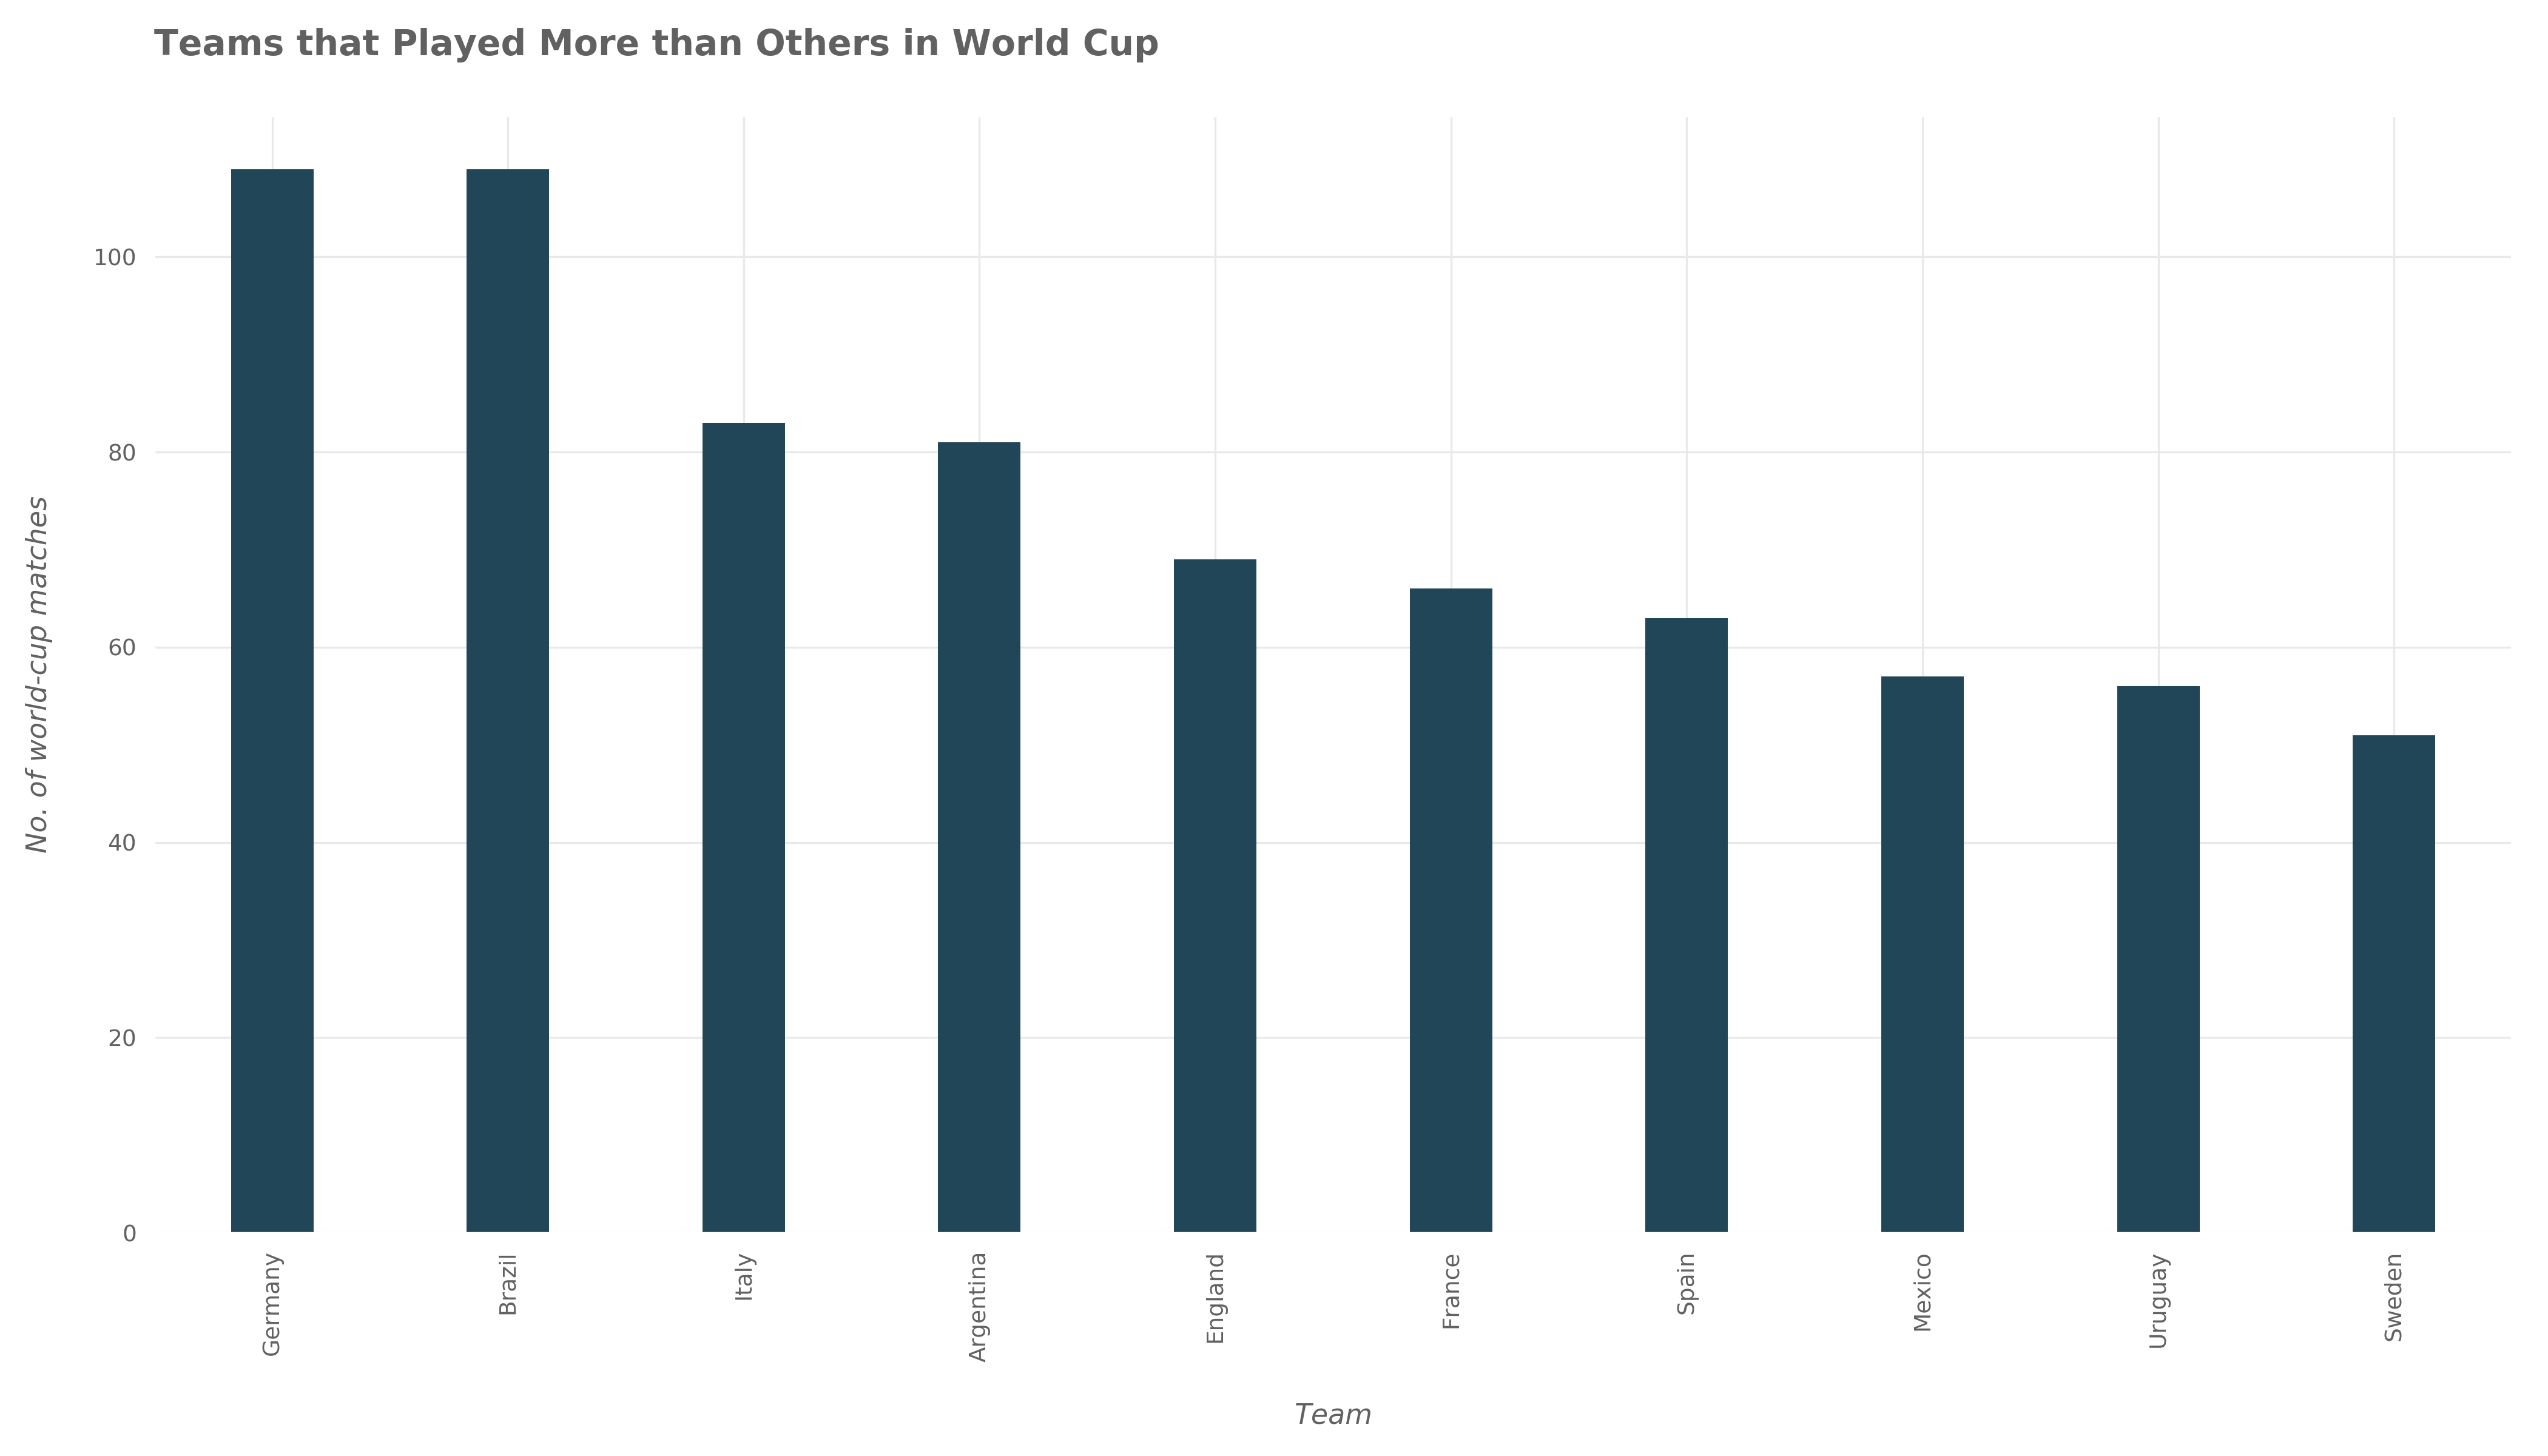
Considering World Cup alone changes the situation. Now Germany and Brazil come first with 109 matches followed by Italy with 83 matches and then Argentina with 81 matches.
Which team achieved more wins than others over the years?
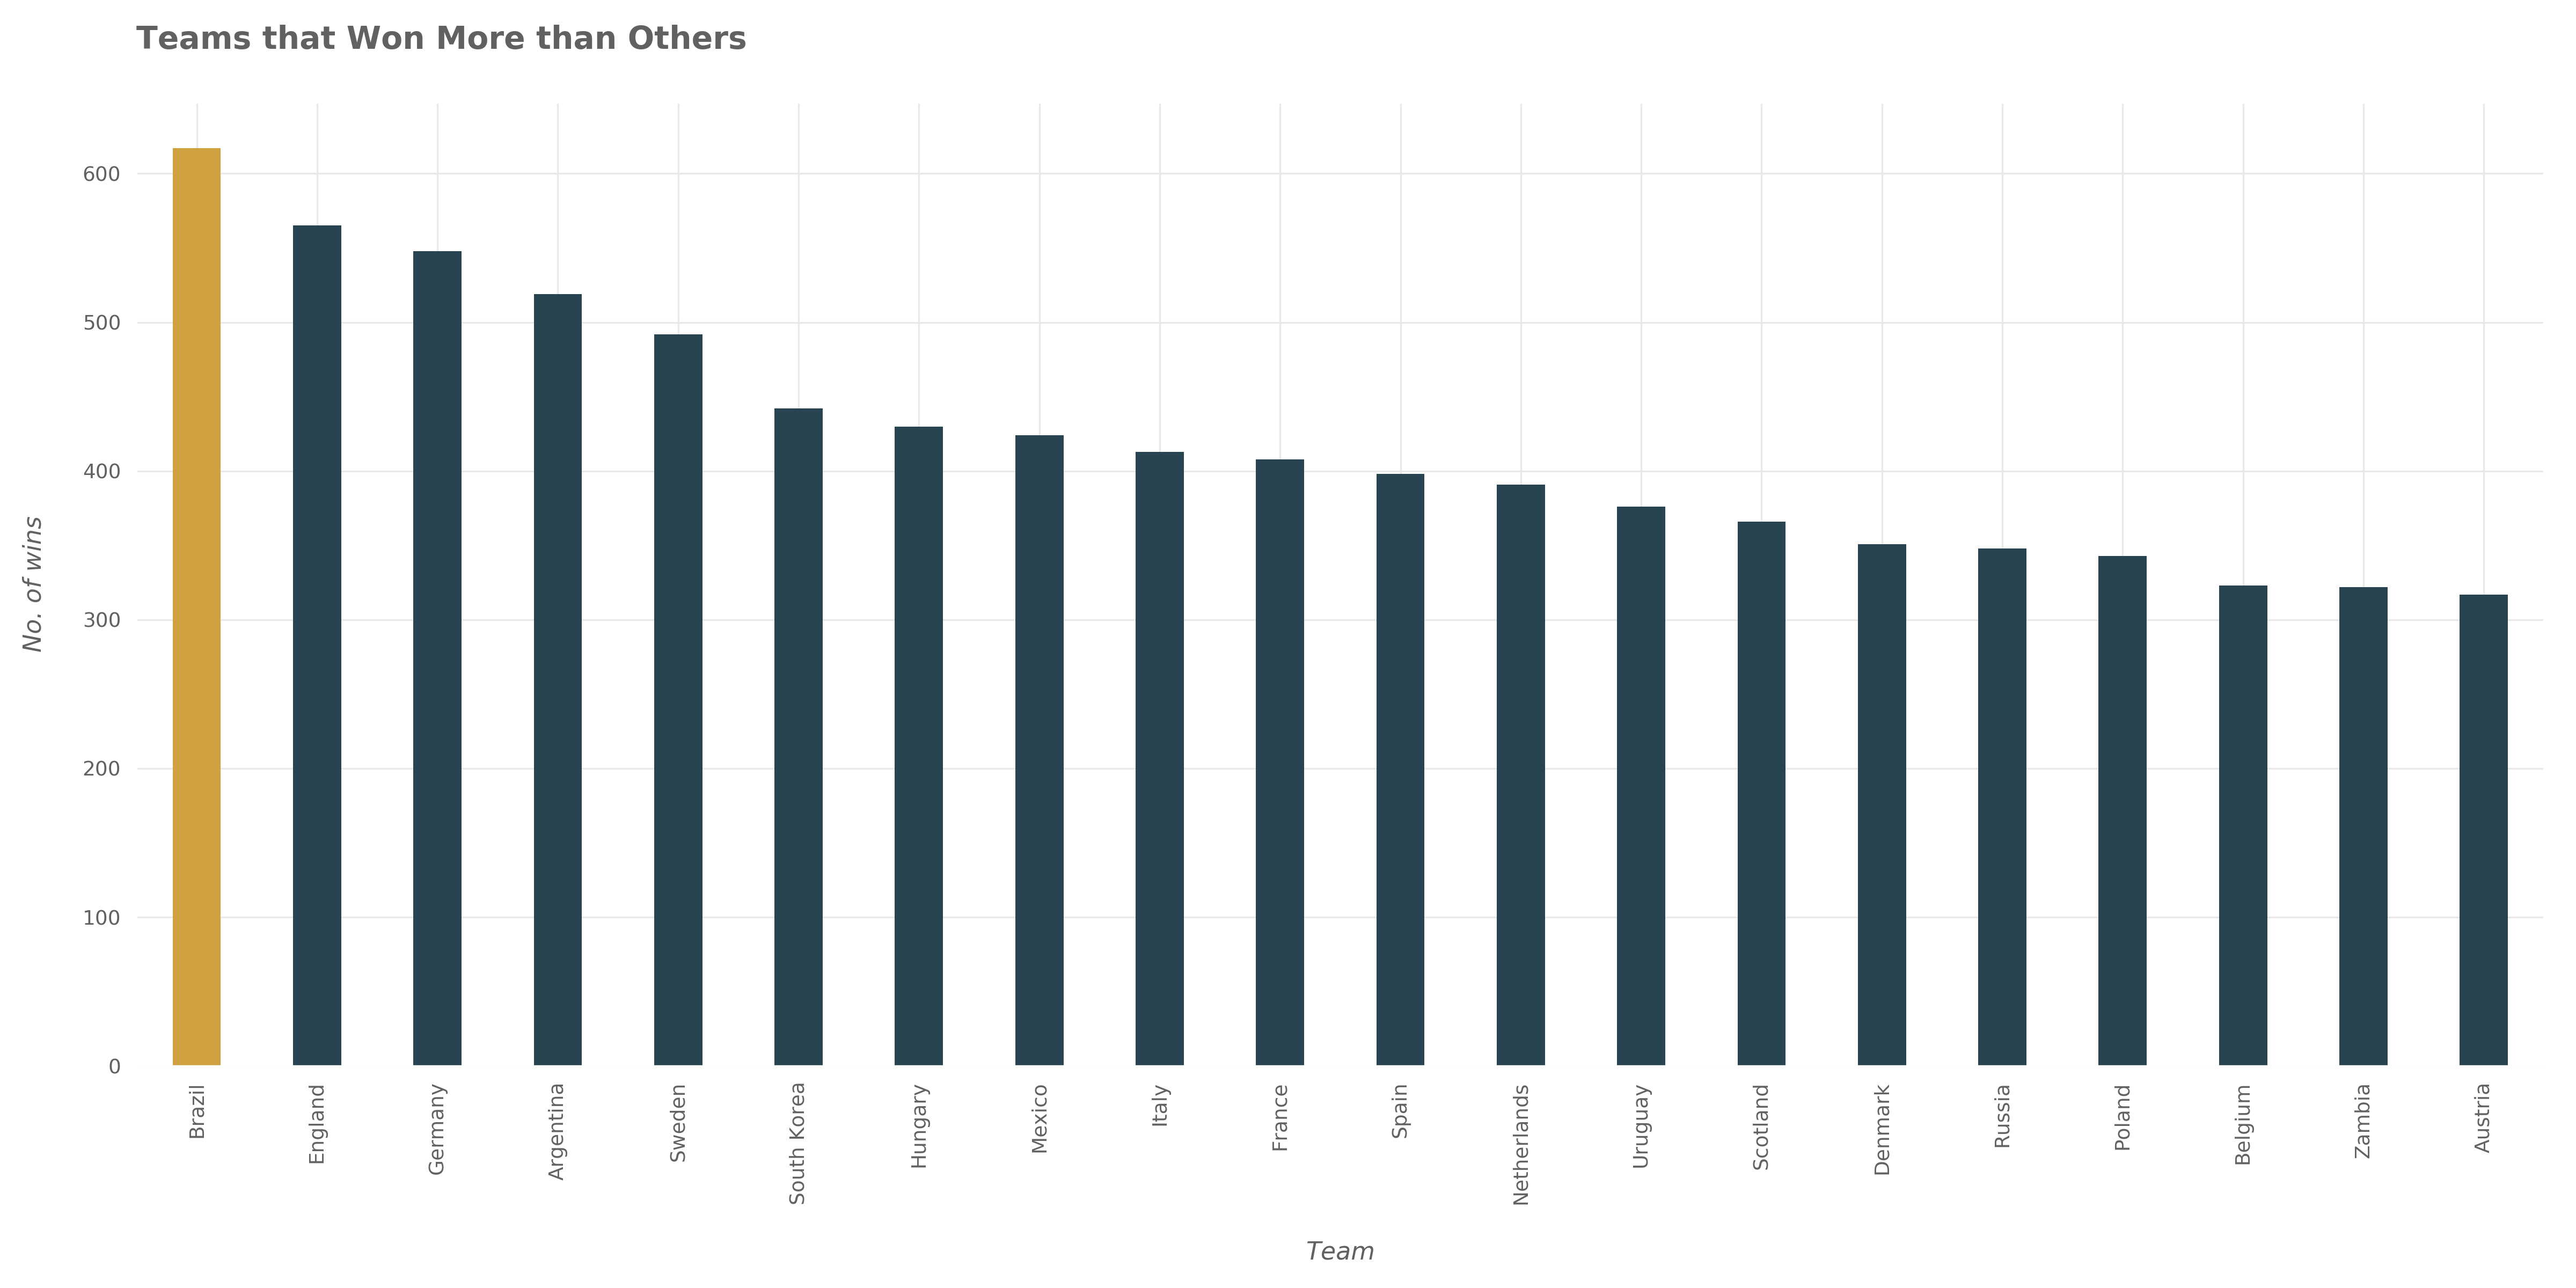
We can see that Brazil achieved wins throughout history more than any other national team in the world; it achieved 617 wins. After Brazil comes England with 565 wins followed by Germany with 548 wins.
Which team lost more matches than others over the years?
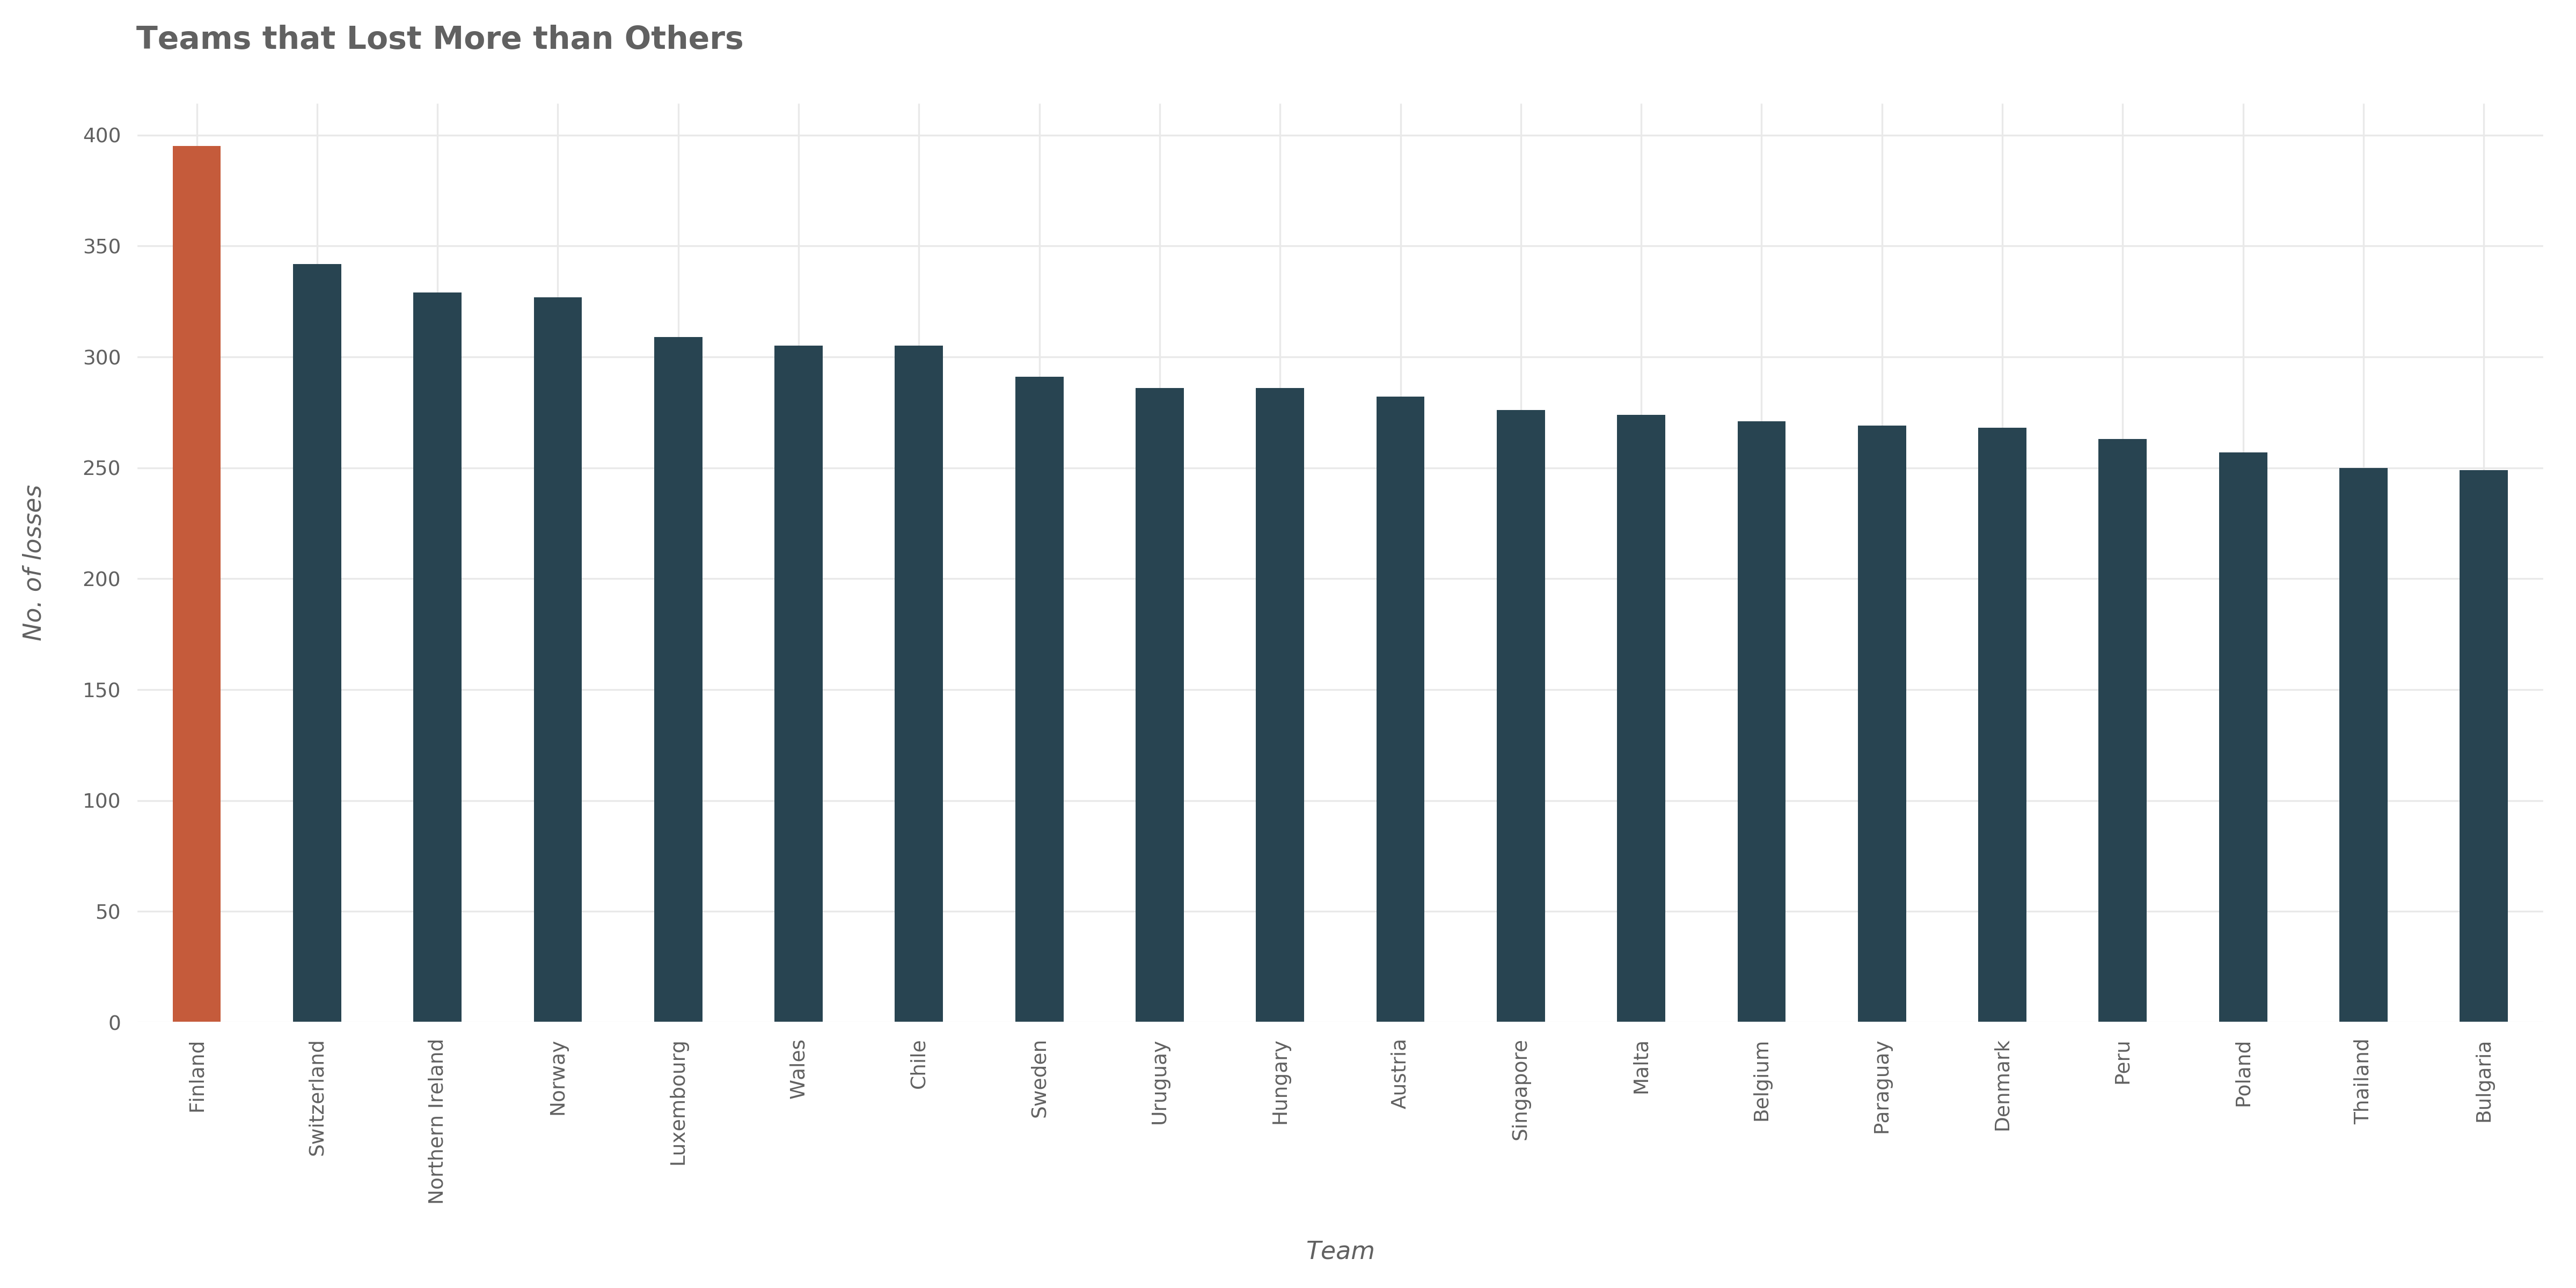
Finland lost more matches than all other teams; it lost 395 matches. Then comes Switzerland with 342 defeats followed by Northern Ireland with 329 defeats.
Wins - Defeats
We saw teams that won the most and teams that lost the most. Now, we want to subtract the number of defeats from the number of wins for each team and visualize the results. This will show us teams that won more than they lost and teams that lost more than won.
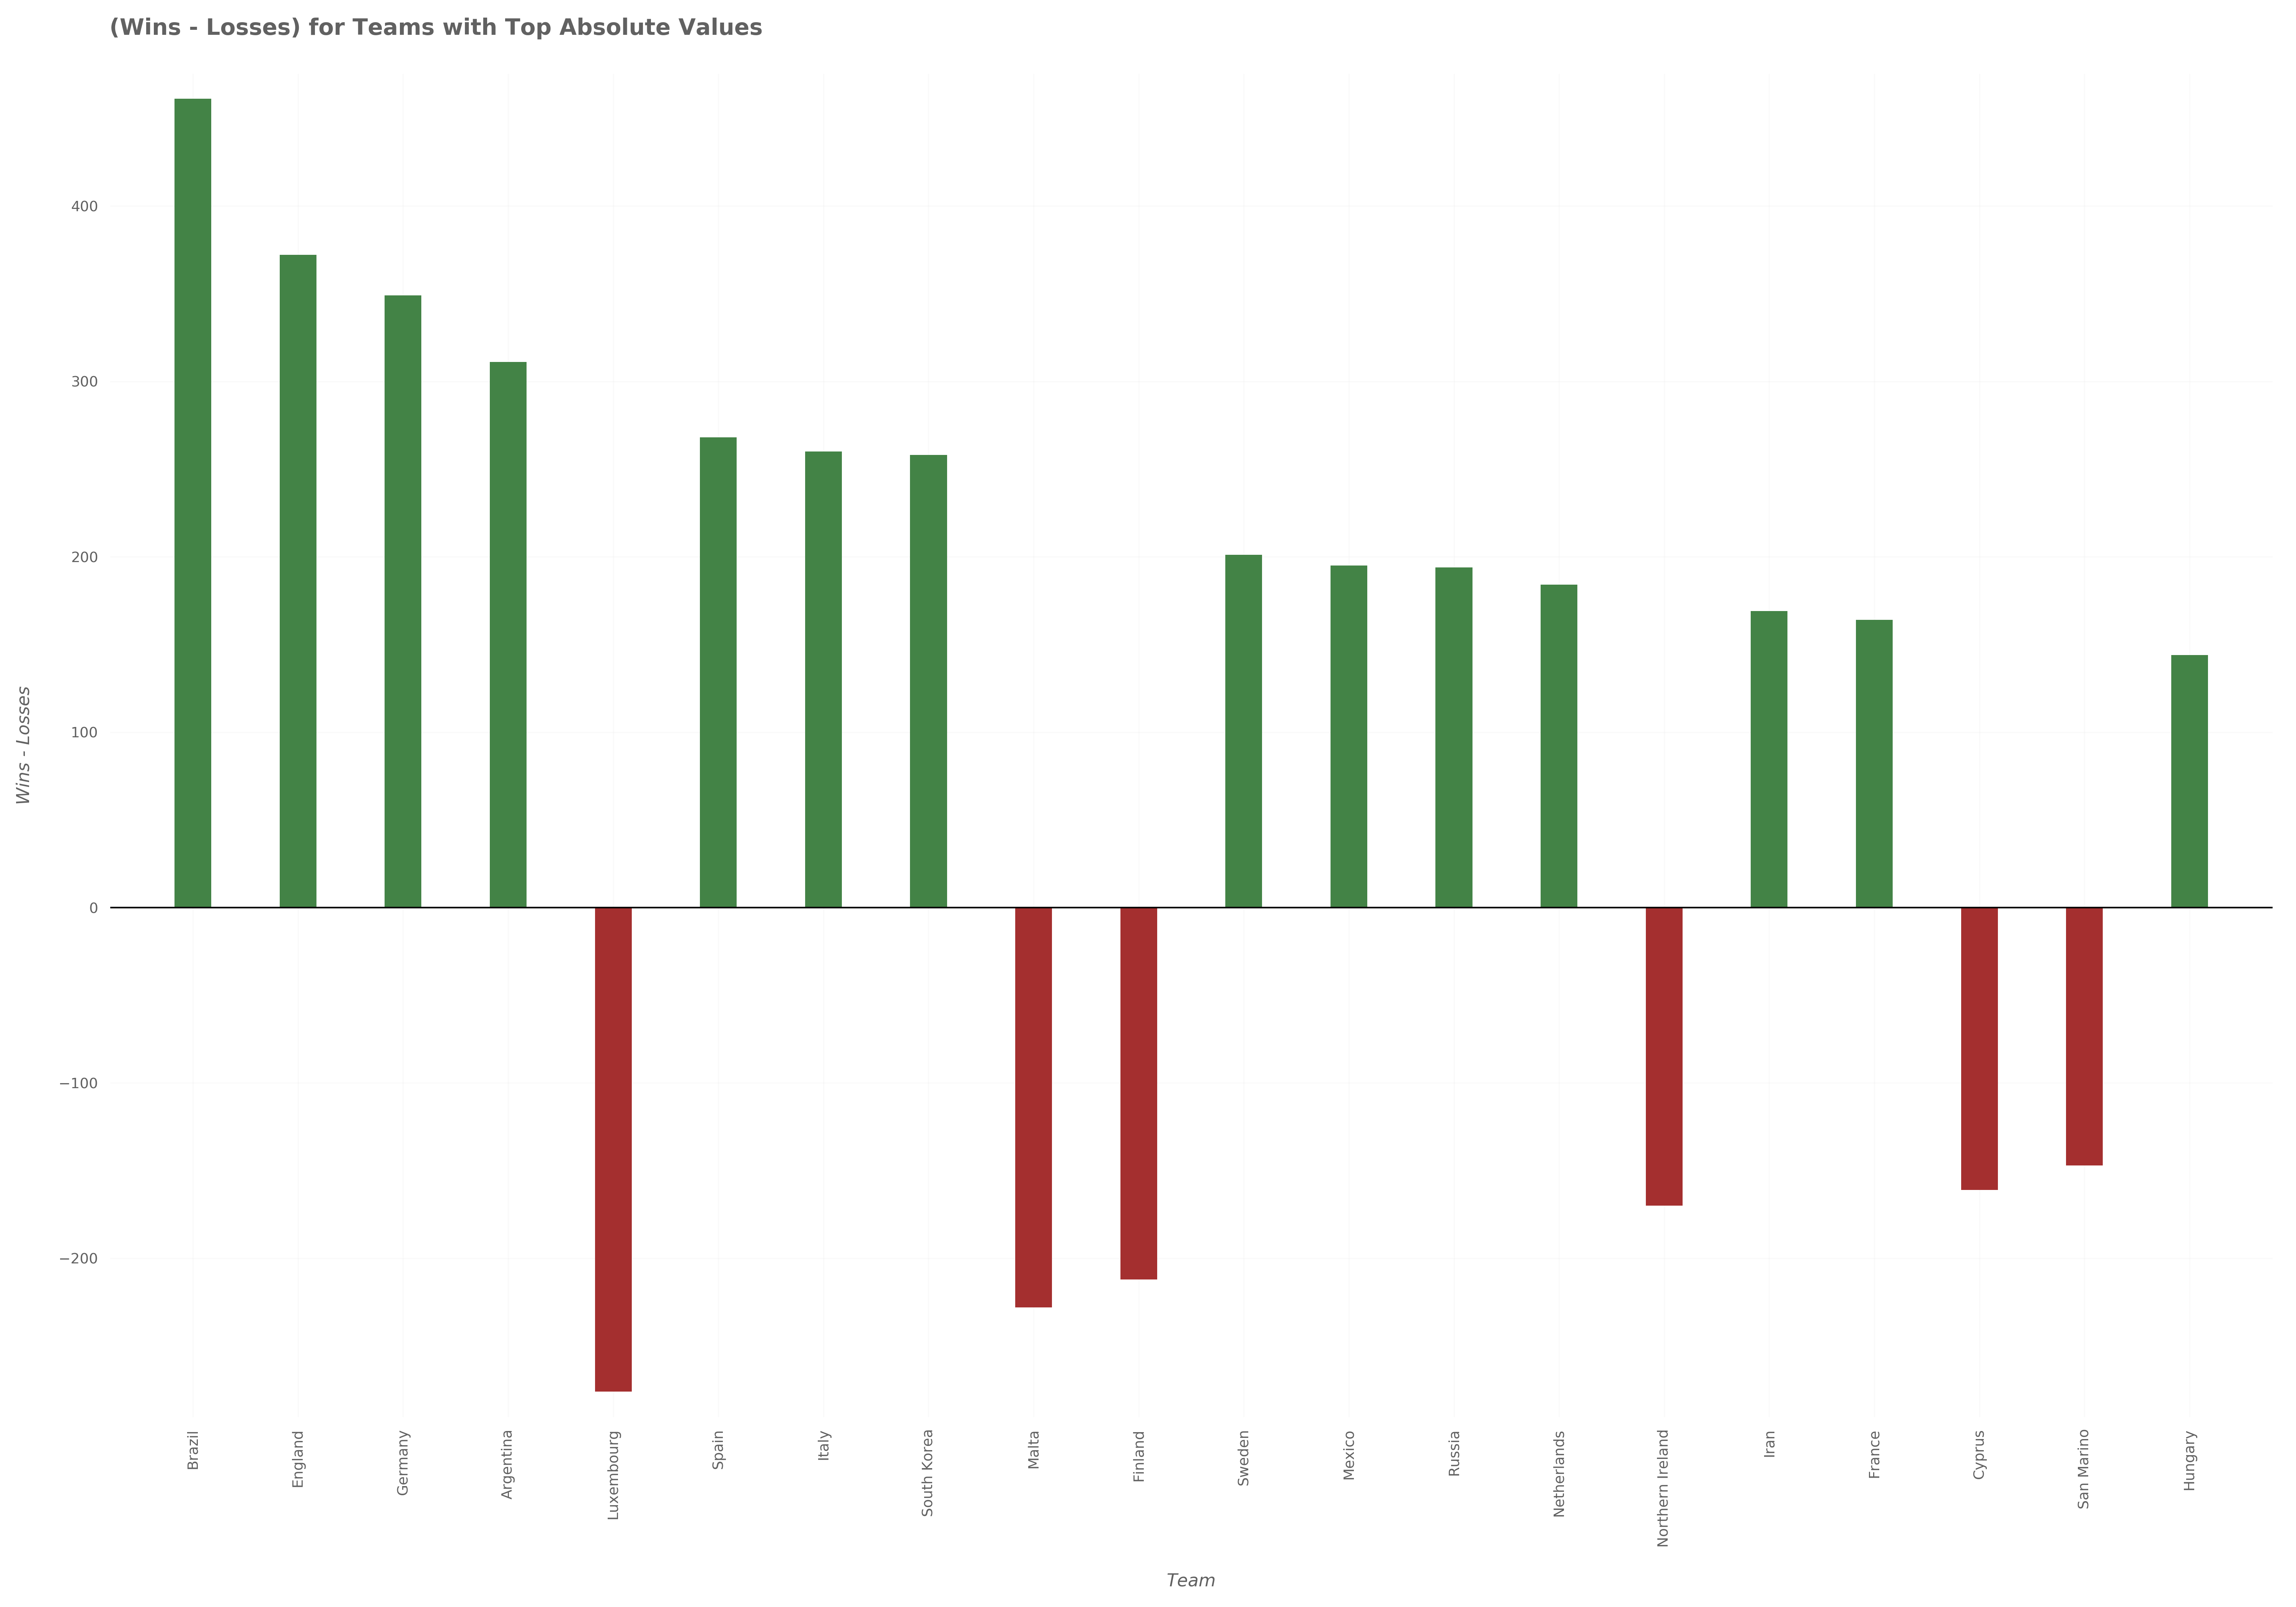
The plot shows the top 20 teams ordered according to the absolute value of (wins - defeats). We see that Brazil comes first with a value of 461 net wins. Then comes England with a value of 372 then Germany with a value of 349. These all have more wins than defeats and they are plotted with green color.
On the other hand, there are countries with more defeats than wins and they are plotted with red color. The first of them is Luxembourg with a value of -276. After Luxembourg comes Malta with a value of -228 then Finland with a value of -212. Notice the minus sign for these teams because we subtracted defeats from wins and the number of defeats for these teams was larger than the number of wins.
Which team scored the largest number of goals throughout history?
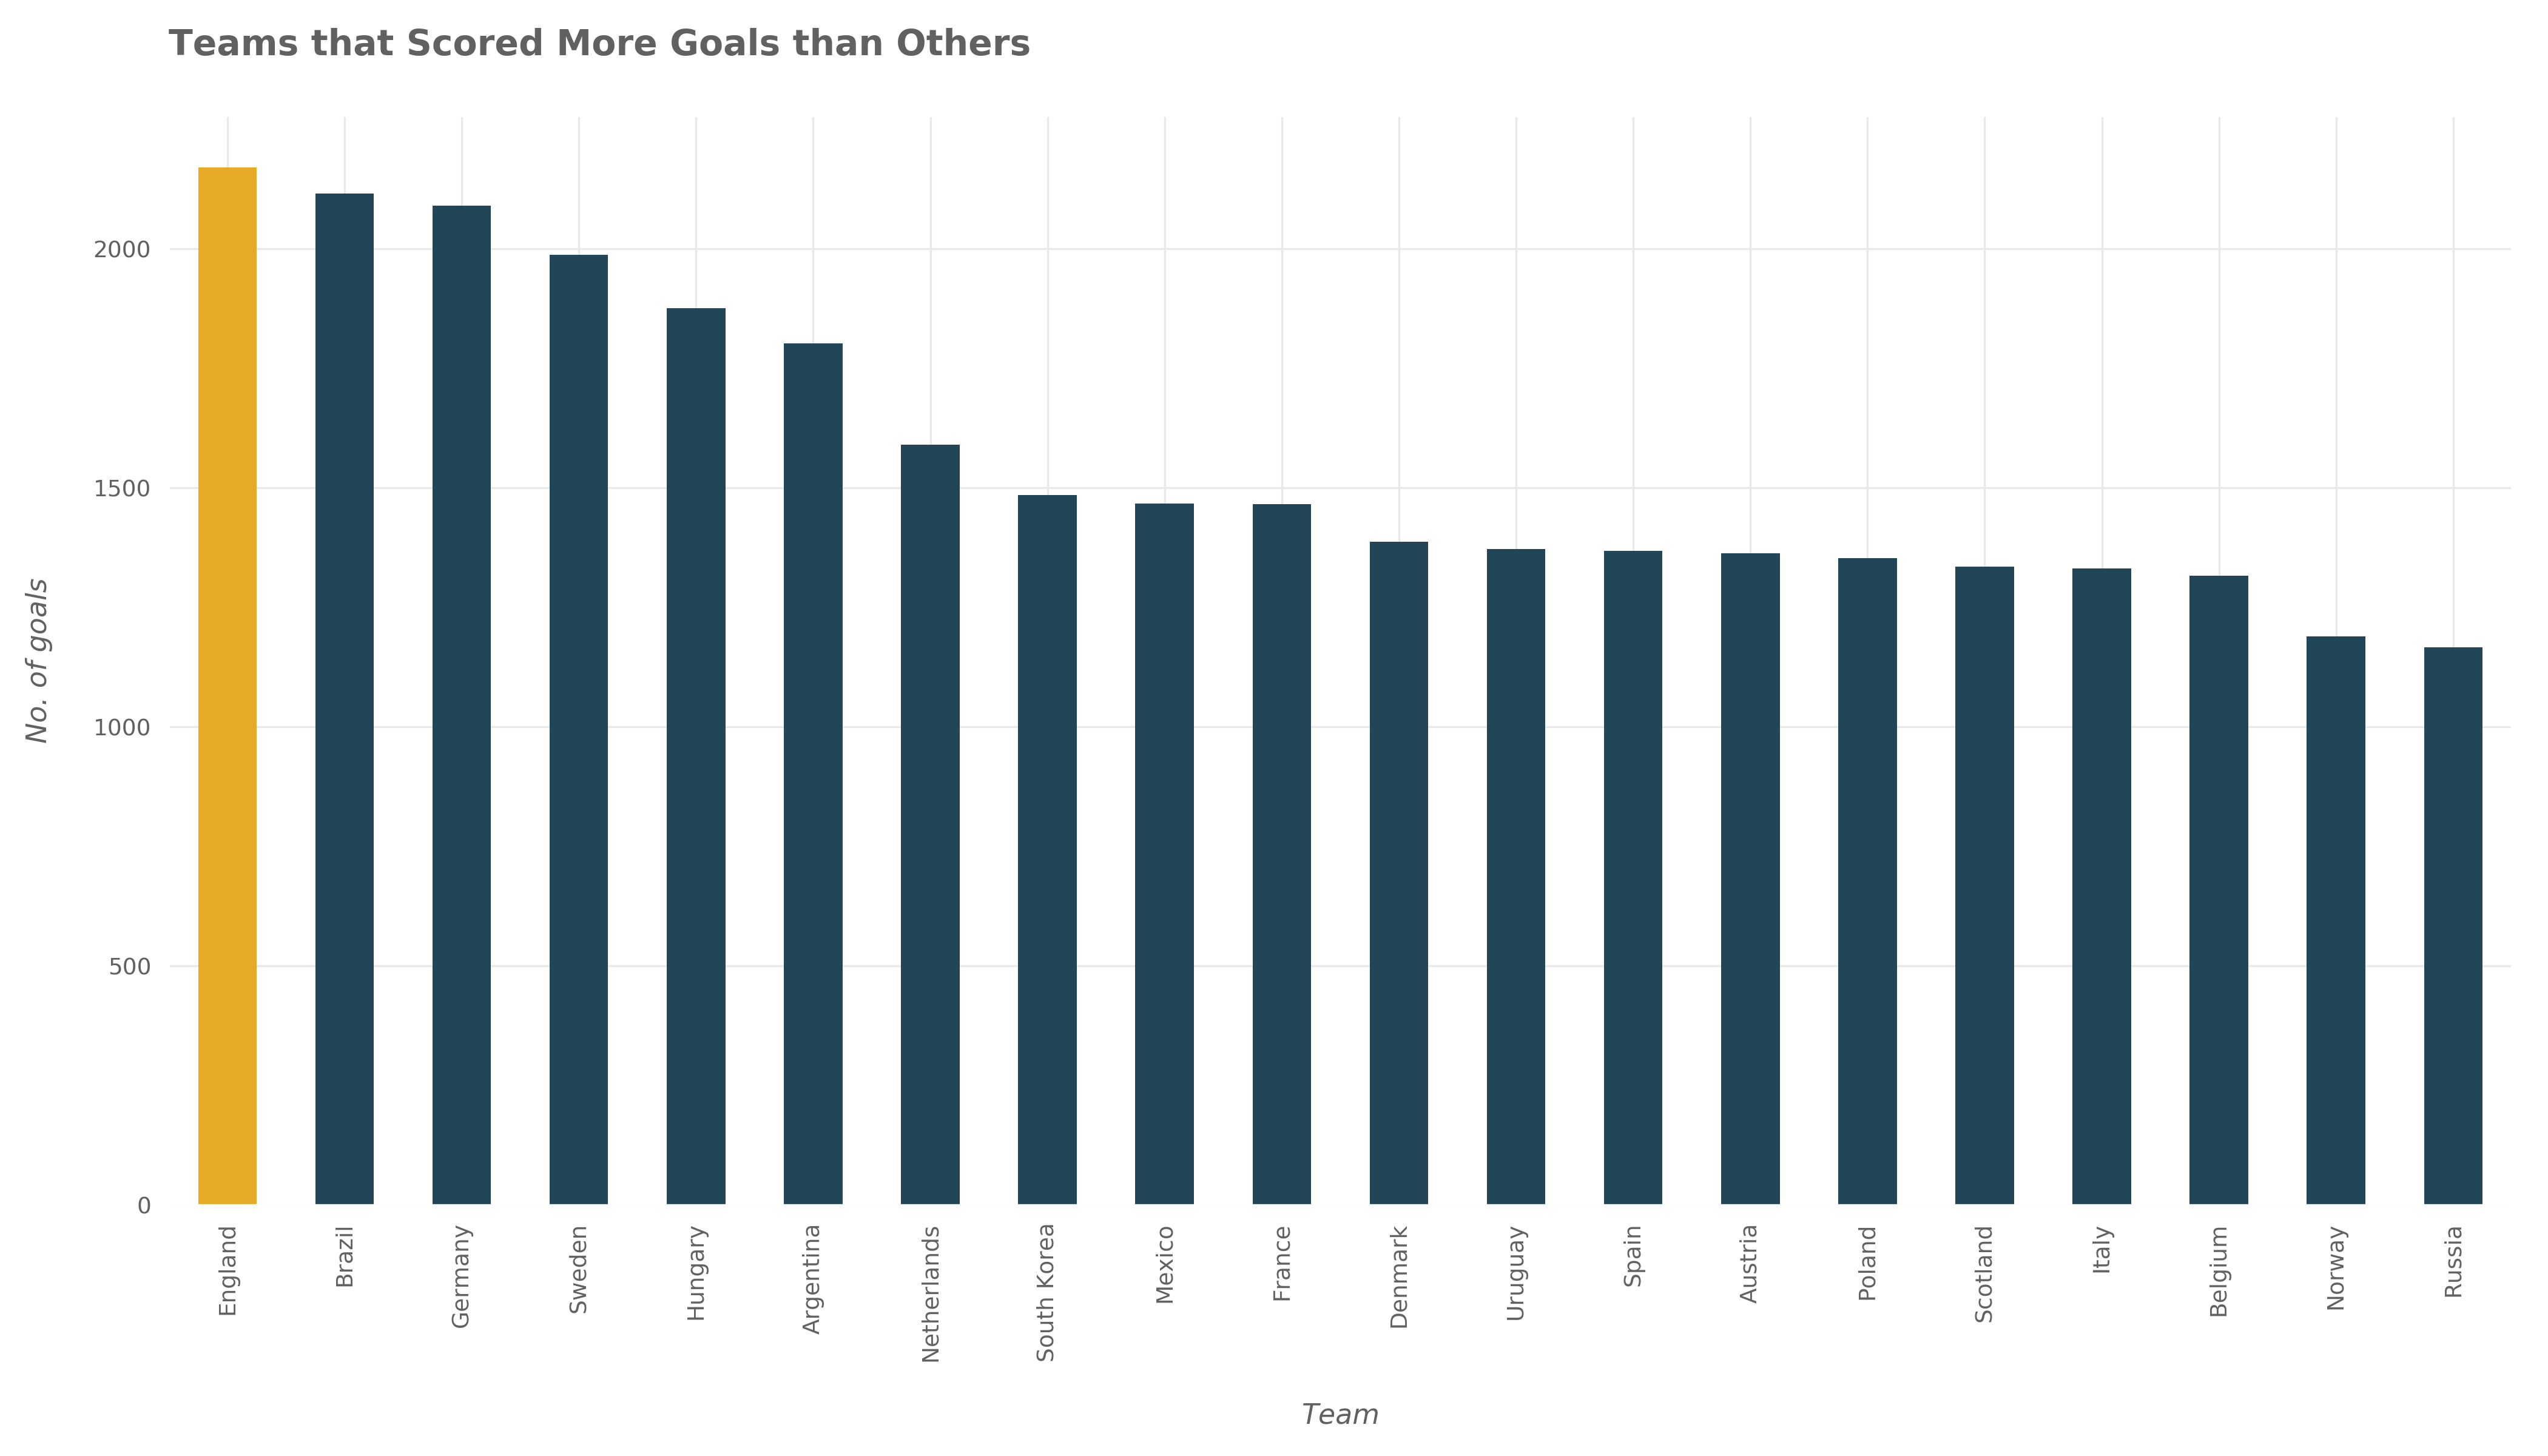
It turns out that England scored more goals overall with 2170 goals, then Brazil with 2116 goals, then Germany with 2091 goals.
Which team scored the largest number of goals in FIFA World Cup?
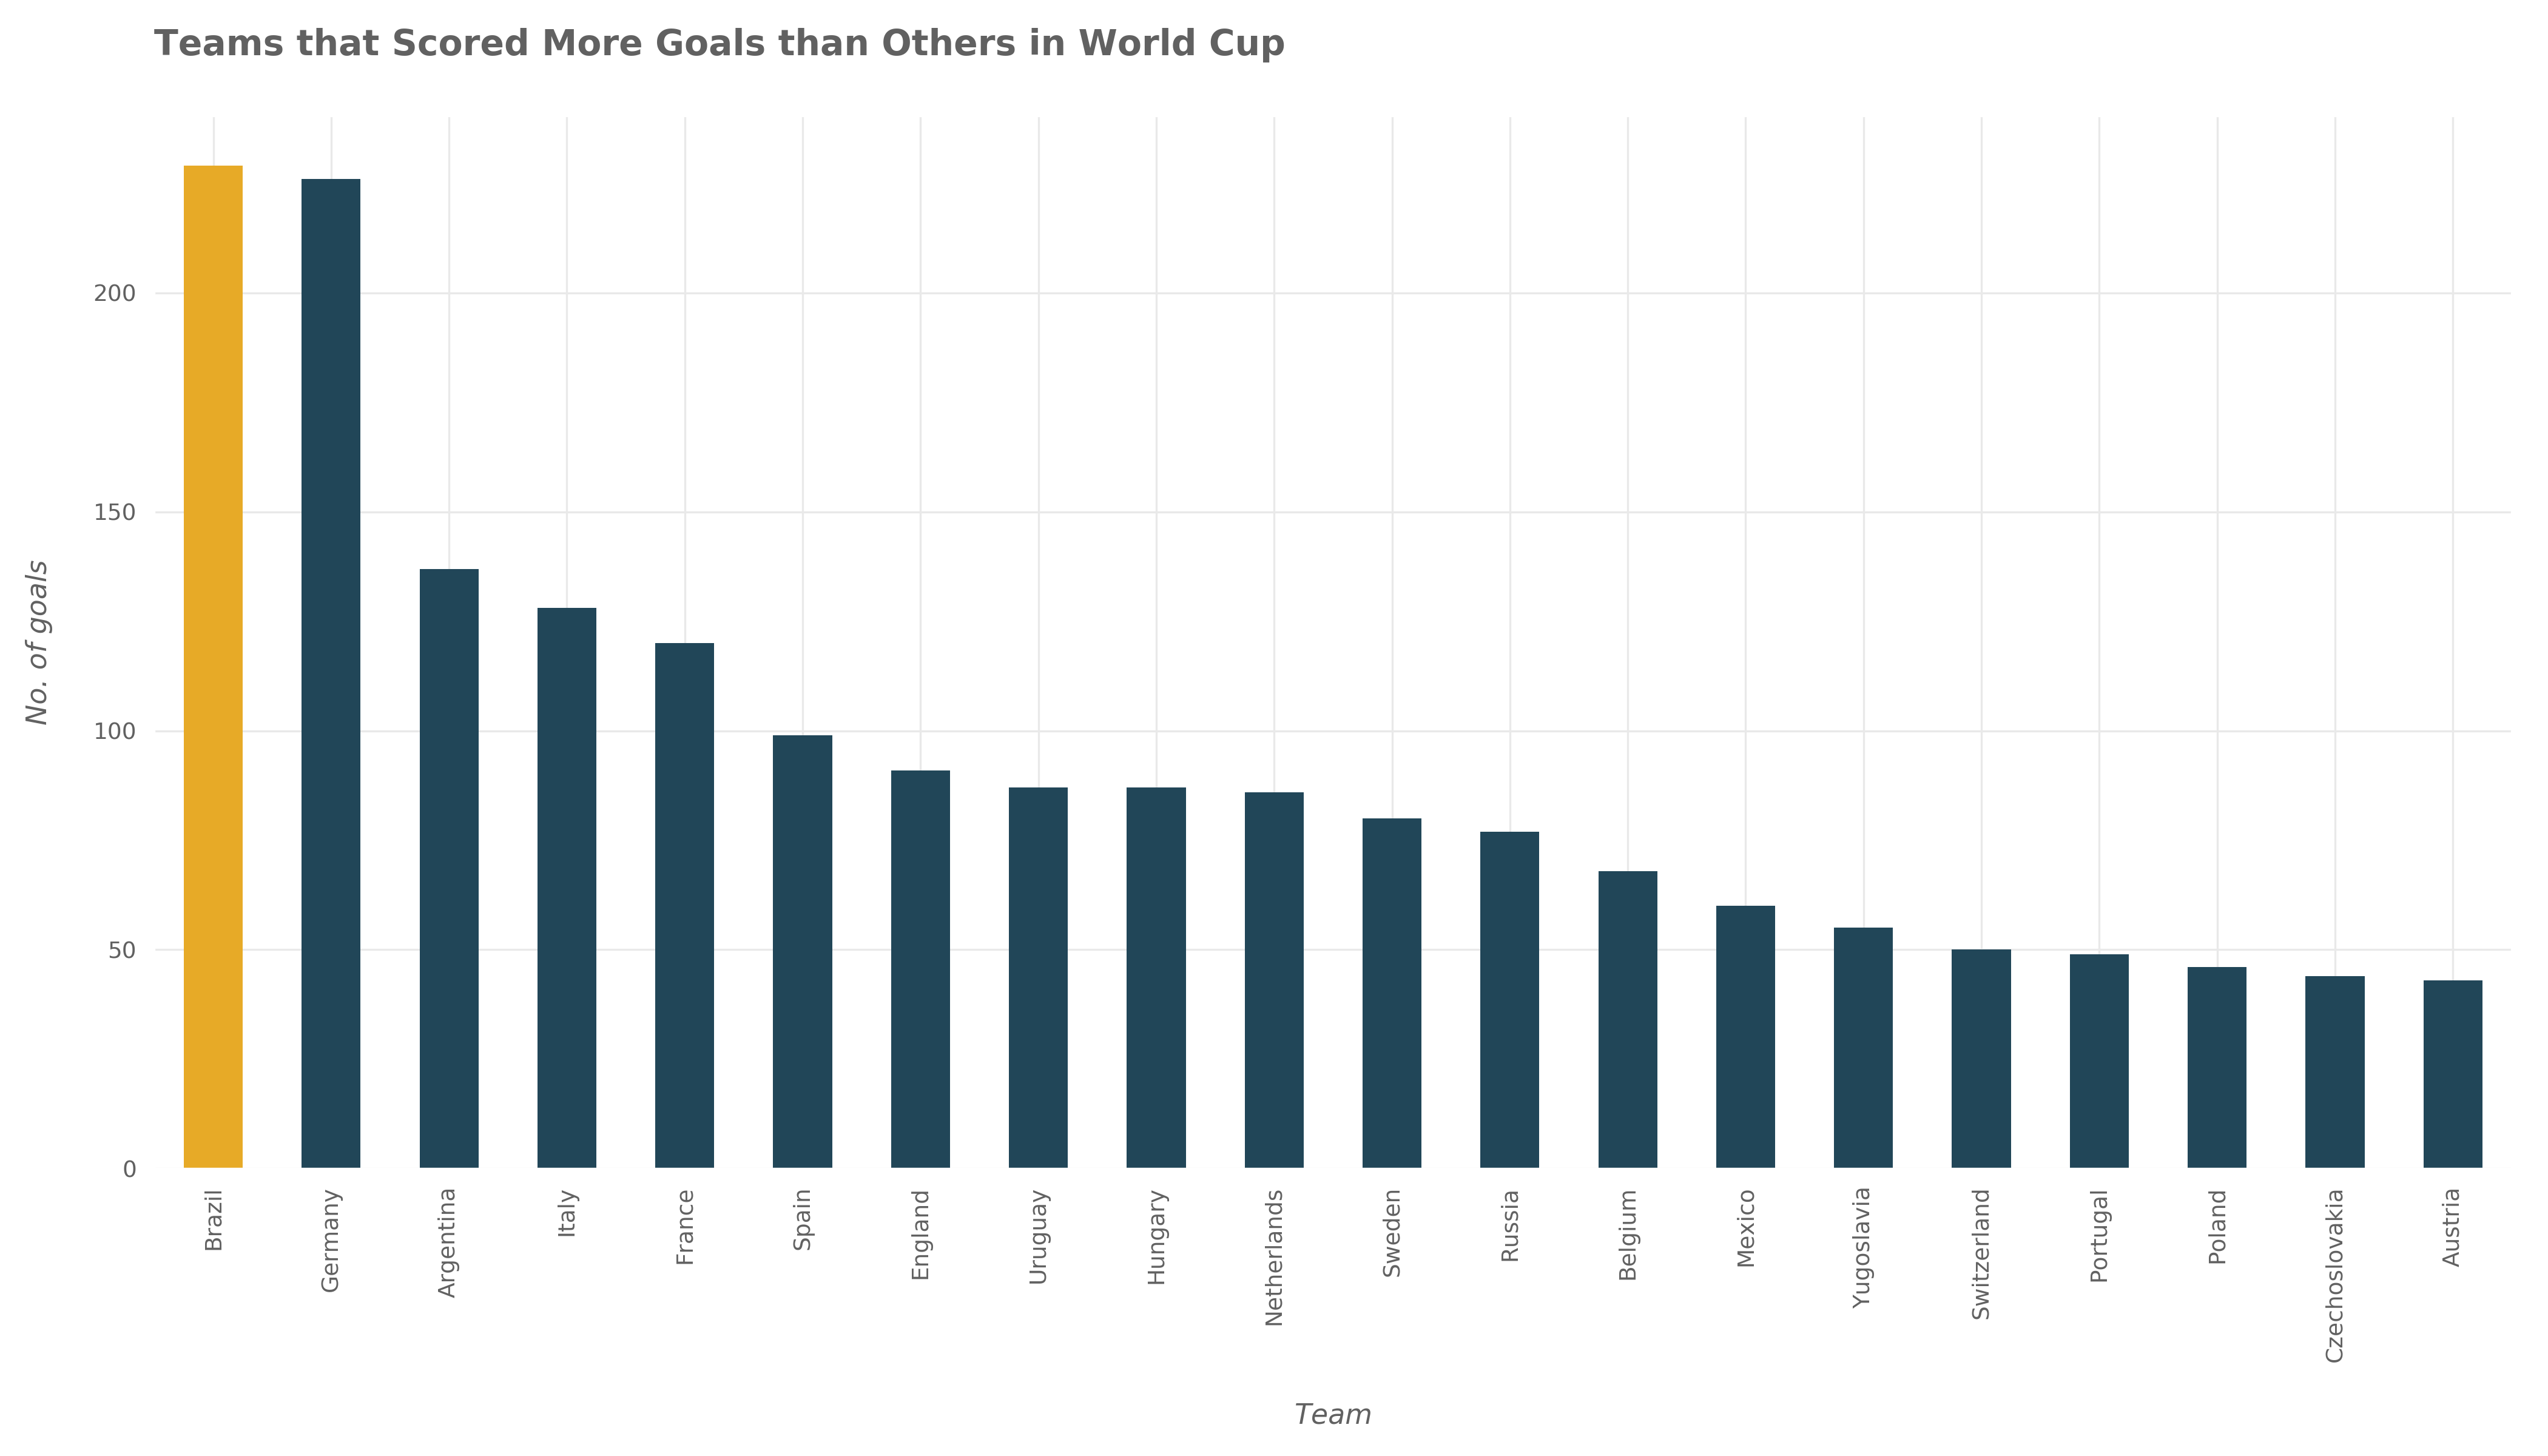
Considering World Cup alone, Brazil comes first in terms of the number of goals scored with 229 goals followed by Germany with 226 goals followed by Argentina with 137 goals.
Which teams played against each other the most?
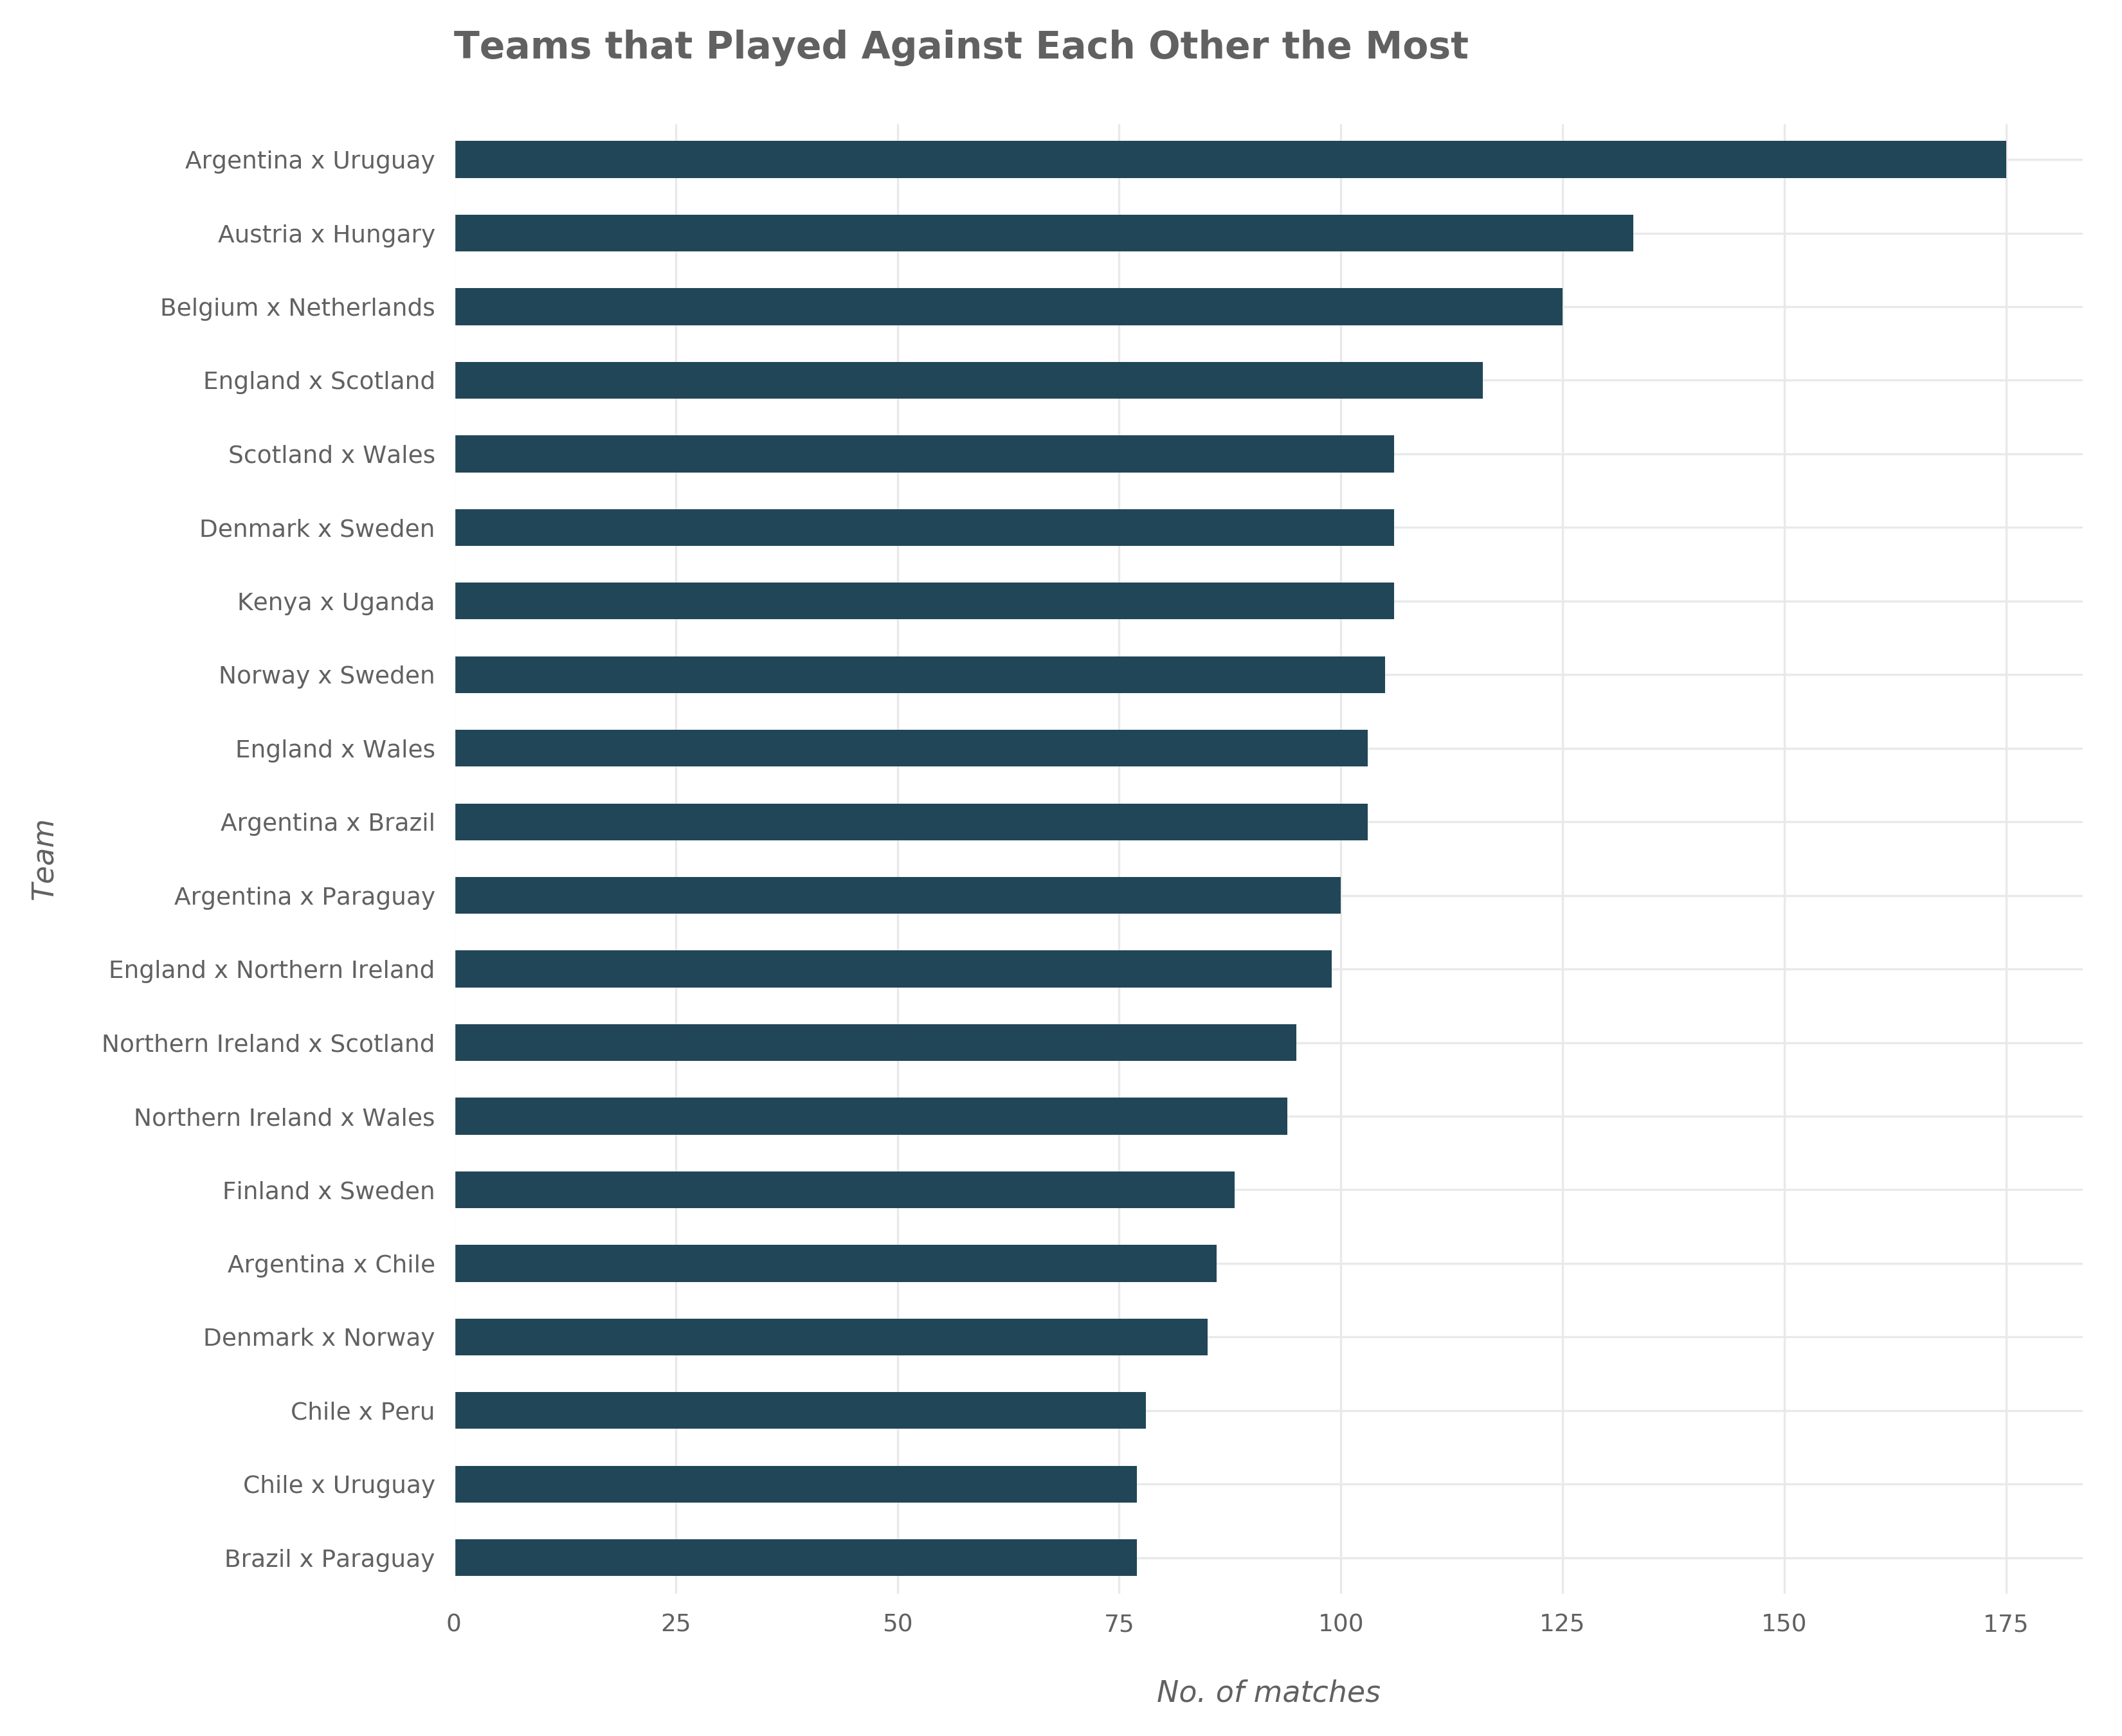
So the two teams that played against each other the most through history are Argentina and Uruguay; they played 175 matches against each other. Then Austria and Hungary which played against each other 133 matches. After that, Belgium and Netherlands which played 125 matches against each other.
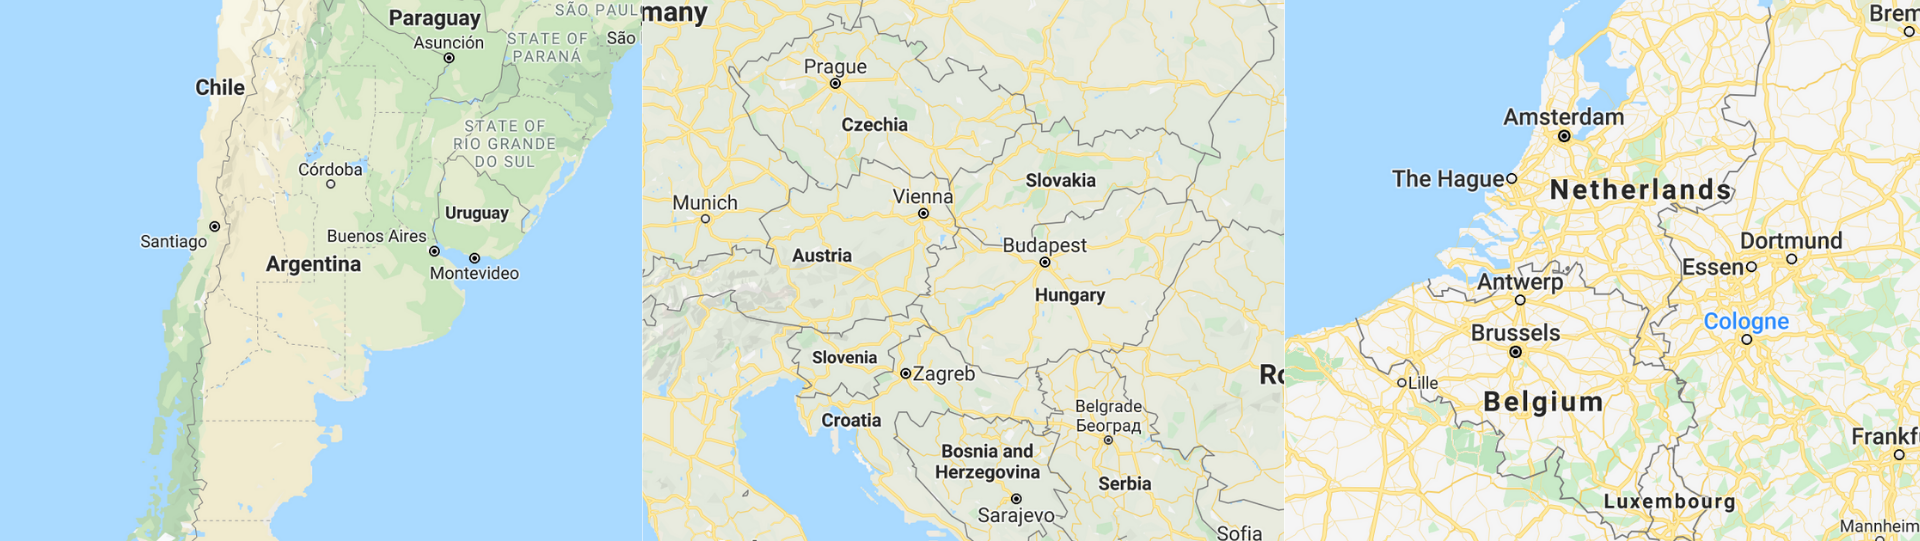
If we look at the maps of these pairs, we can see that each pair consists of adjacent countries. Look at the images below.
Do Friendly Matches Have Less or More Goals than Non-Friendly Matches?
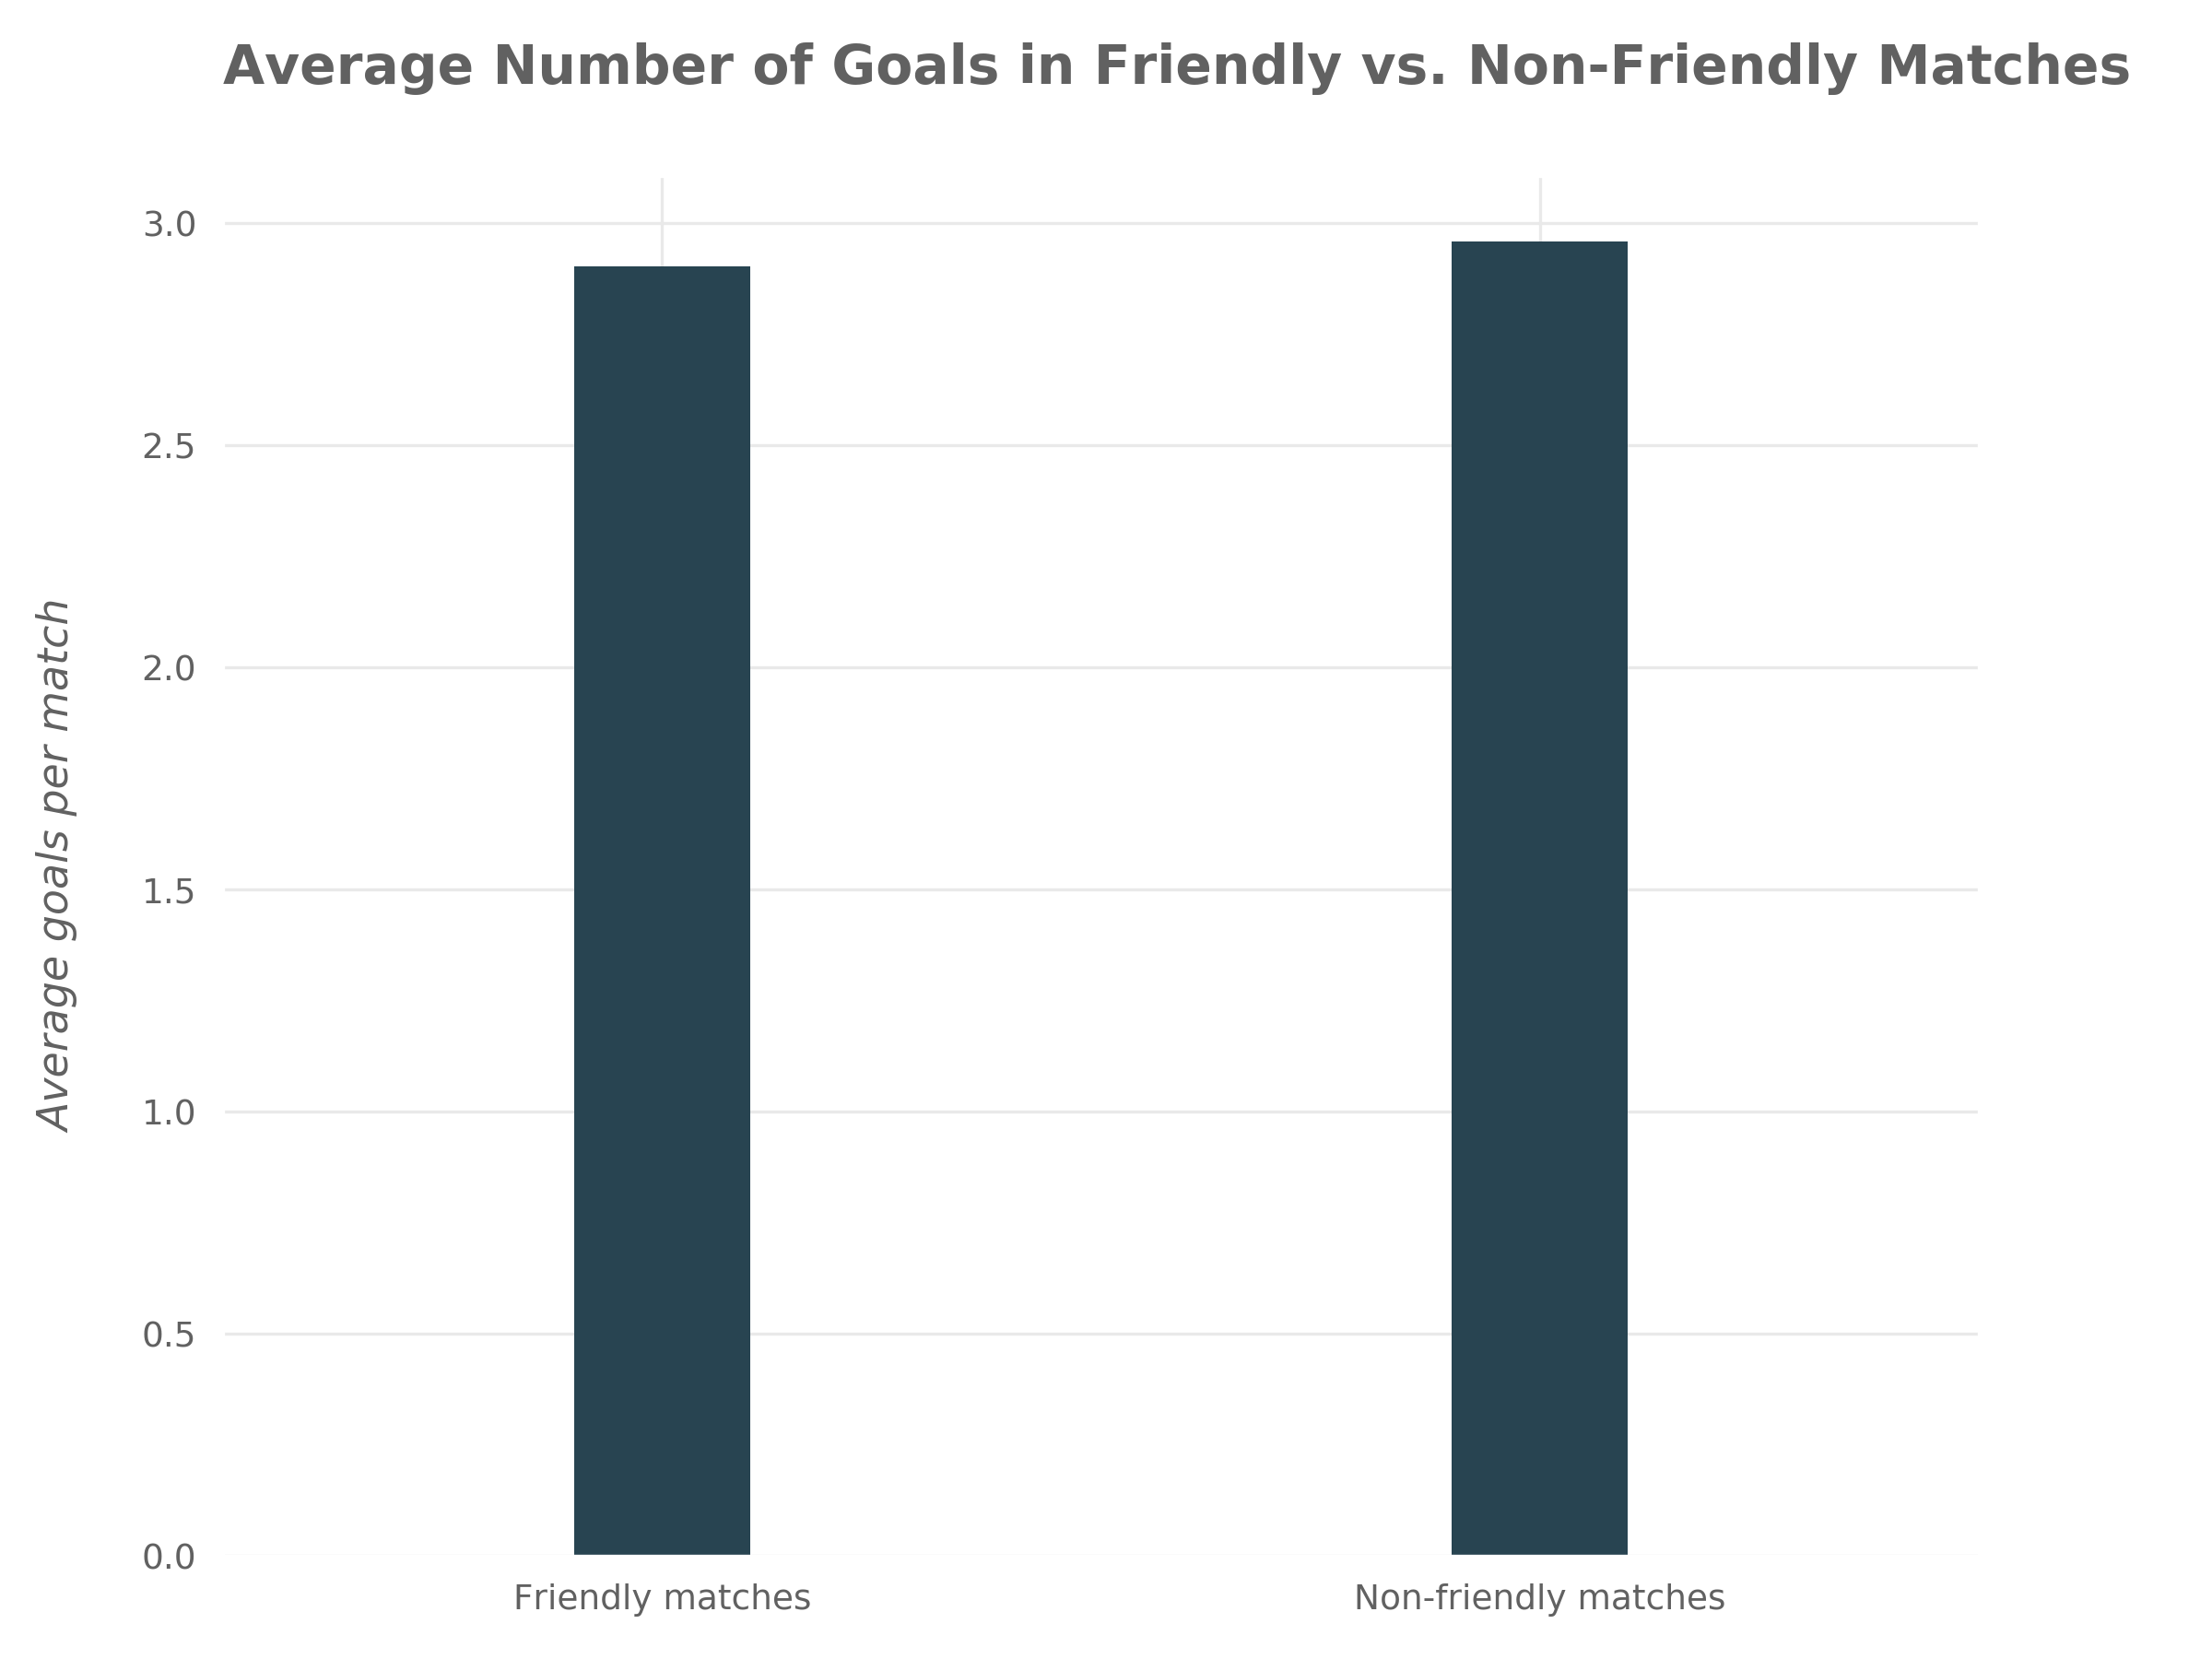
As can be seen in the plot, there is no considerable difference between the average number of goals in friendly matches and the average number of goals in non-friendly matches.
In which tournament players tend to score more goals?
From the plot, we can see that a match in the “British Championship” tournament has on average 3.5 goals. The “CFU Caribbean Cup qualification” tournament has a very close average. After that, the “Merdeka Tournament” has an average of 3.3 goals per match.
Also, we can see that friendly matches tend to have more goals than FIFA World Cup matches and that FIFA World Cup qualification matches tend to have more goals than FIFA World Cup matches.
What’s the percentage of matches that ended in draw?
What is the number of matches played in each tournament throughout history?
From this treemap plot, we can see that friendly matches constitute the largest part of international matches with 16,795 matches out of the total 40,407 matches. After friendly matches come “FIFA World Cup qualification” matches, then “UEFA Euro qualification” matches.
How does the number of matches change through years? Did the 1990s have more matches than the 1980s?
From this plot which shows the number of matches per year, we can notice that, generally, the number of matches tend to increase over the years. The year that witnessed more matches than all other years was 2008 with1091 matches.
How does the number of goals change through years?
And to see the relationship between the number of matches and the number of goals through the years, the following plot combines the previous two plots.
Which month through history had more matches? Is it June, August, or others? Does the number of matches actually differ from month to month?
We can see that the number of matches differs from one month to another. June is the month of the year that witnessed more matches than other months with 5,706 out of the total 40,407 matches. On the opposite side, January is the month that witnessed the least number of matches, 2,148.
Which day of the week had more matches through history? Did most matches occur in weekends?
We can see that more matches occurred on Sunday than all other days of the week: 9,943 matches. Sunday is followed closely by Wednesday with 9,808 matches. On the opposite side, Monday witnessed the least number of matches: 2,313.
Summarized Results
These summarized results don’t substitute the results above but can help you remember somethings from the analysis.
During the period between 1872 and 2018:
- Sweden 🇸🇪 played matches more than any other country
- German 🇩🇪 played World Cup matches more than any other country
- Brazil 🇧🇷 won matches more than other countries
- Finland 🇫🇮 lost matches more than other countries
- Brazil 🇧🇷 has 461 net wins—more than any other country
- Luxembourg 🇱🇺 has 276 net defeats—more than any other country
- England 🏴 scored more goals than the rest
- Brazil 🇧🇷 scored more goals in World Cup than the rest
- Argentina 🇦🇷 and Uruguay 🇺🇾 played against each other more than any other two teams
- 23.1% of international matches ended in draw
- June witnessed more matches than other months
- Sunday witnessed more matches than other days
Future Work
For future work, I might do more in-depth analysis focusing on particular teams or particular areas. For example, an in-depth analysis might be performed on Brazil team to see how its performance varied through the years.
Also, an analysis can be done to see which teams have correlated performance (i.e. their performances improve together and worsen together). Moreover, an analysis can be done to compare continents with each other like comparing South American teams and European teams. Finally, an analysis can be performed on teams that share something in common like Gulf Cooperation Council teams.
Liked this post? Share it and help me a reach bigger audience: link to this post