Analysis of YouTube Trending Videos of 2019 (US)

This analysis was featured on: The Hustle newsletter (lead story), TechCrunch, Hacker News, The Growth Newsletter (issue #021), Social Blade, Data Science Weekly newsletter (Jul 09 2020's issue), Weekly, Tubefilter, Younes Talk, and more.
Around 1.5 years ago, I did an analysis of YouTube trending videos in US. That analysis was performed on trending videos of some months in 2017 and 2018. The analysis received a lot of interest on Kaggle and Reddit; I also received some emails praising the work done. That was 1.5 years ago.
Today, I present an improved and expanded version of that analysis. This analysis is more advanced and contains new interesting elements. In this analysis, All trending videos for the whole year of 2019 were analyzed (More than 70,000 videos).
Titles, descriptions, thumbnails, tags, views, likes/dislikes, and comments were all analyzed to produce the results shown in this post. Continue reading to know more about the analysis and the data or you can jump directly to the results section.
- Summary of Some Key Results of the Analysis
- What are YouTube Trending Videos?
- Tools Used
- Data Source
- Data Size and Description
- Analysis Results
- Trending Videos and Views
- Trending for 30 days!
- Trending Videos Titles
- Trending Channels
- Trending Videos Categories
- When were Trending Videos Published?
- Trending Videos and Comments
- Trending Videos and Likes.. and Dislikes
- How Long Does it Take a Video to Become Trending?
- Trending Videos Descriptions
- Trending Videos Tags
- Correlations of Trending Videos
- What are the Most Used Colors in Trending Videos Thumbnails?
- What’s Inside Trending Videos Thumbnails?
- Conclusion
Summary of Some Key Results of the Analysis
The main goal of the analysis is to find interesting facts and patterns by exploring the data and by using effective visualizations.
If you don’t have time to read the full analysis, here are some of the insights that were extracted from the data along with links to their sections in the analysis:
- Linus Tech Tips (a technology channel) was the channel that produced most trending videos in 2019. It is a technology (not entertainment nor music) and personal (not corporate) channel. More than that, the 2nd and 3rd channels after Linus Tech Tips were cooking channels.
- While a video might stay on the trending list for one day or less, there are 6 videos that appeared on the list for 30 days.
- BTS’ song “Boy With Luv” was the most viewed, liked, and commented video. However, it was also the 5th most disliked video.
- Some videos appeared on the trending list when they had only around 50,000 views.
- Words like “official”, “video”, “2019”, “vs”, “trailer”, “music”, “game”, “new”, “highlights”, “first”, and “challenge” were among the most common in trending video titles. So if you include the current year in your title, does that increase trending chances?
- 🔥 was the most common emoji in trending video titles.
- While the minimum was 3 and the maximum was 100, most trending videos have titles lengths between 36 and 64 characters.
- There was a video that became trending when it had only 7 comments.
- YouTube Rewind videos of 2018 and 2019 were the 1st and 2nd most disliked videos.
- On average, videos take 1.5 days to appear on the trending list for the first time.
- While the allowed maximum is 5,000 character, most trending videos have their descriptions length between 500 and 1500 characters.
- A lot of trending videos put social media links in their descriptions.
- Almost all trending videos use tags. On average, 21 tags.
- By running an object-detection algorithm on the thumbnails of trending videos, it turned out that a person is the most common object in the thumbnails. So you might consider adding a person photo in your next video.
- Do you want to see the most common colors in video thumbnails that were extracted after a lot of processing?
The analysis covers much more as you will see soon…
What are YouTube Trending Videos?
YouTube, as you know, is the most popular and most used video platform in the world today. YouTube has a list of trending videos. I’ll quote the description of trending videos from YouTube itself:
Trending helps viewers see what’s happening on YouTube and in the world. Trending aims to surface videos that a wide range of viewers would find interesting. Some trends are predictable, like a new song from a popular artist or a new movie trailer. Others are surprising, like a viral video. Trending isn’t personalized and displays the same list of trending videos in each country to all users.
The list of trending videos is updated roughly every 15 minutes. With each update, videos may move up, down, or stay in the same position in the list.
Tools Used
This analysis was performed using Python and a powerful group of Python libraries including Pandas, Matplotlib, NLTK, ImageAI, WordCloud, and more.
The analysis were performed in a Jupyter Notebook.
Code Used
You can find all the code used for this analysis in a Jupyter notebook on this link. Feel free to read the code and re-use it however you want. Also note that the notebook contains more analyses than the ones shown here in this post, so if you want to see everything, refer to the notebook after you finish reading this post.
Data Source
The data used in this analysis was retrieved using YouTube API. A script was scheduled to run each day throughout 2019 and fetch data from YouTube API about the trending videos of that day. The script would then process the data received from YouTube and store them in text files.
The scraping script is not my work. It can be found on Github: Trending-YouTube-Scraper. I put the script on a AWS EC2 instance and scheduled it—using Crontab—to run every day at a specific time.
After 2019 ended, I connected to the AWS instance using FileZilla application and downloaded all the data produced by the script. There was a file for each day of 2019. To perform the analysis, I needed to process the data in order to merge the files into a single CSV file.
Data Size and Description
In this post, United-States trending videos will be analyzed, which constitute a total of 72,994 videos. YouTube usually place 200 videos in the trending list each day which would mean that we should have 73,000 (365 x 200) videos. We have 72,994. This is probably because on a few days, the number of Trending videos was slightly less than 200.
So we have data on 72,994 trending videos to analyze. On YouTube, the same video might appear on the trending list for many days. This means that the 72,994 videos are not unique videos. In fact, among the 72,994 videos, we have 11,177 unique videos.
In other words, 11,177 videos showed on the trending list throughout 2019. Some of them might have stayed on the list for 10 days, some for 20 days, etc. We will see later in the analysis more info about this.
The following table shows an example of the data that we have for each video:
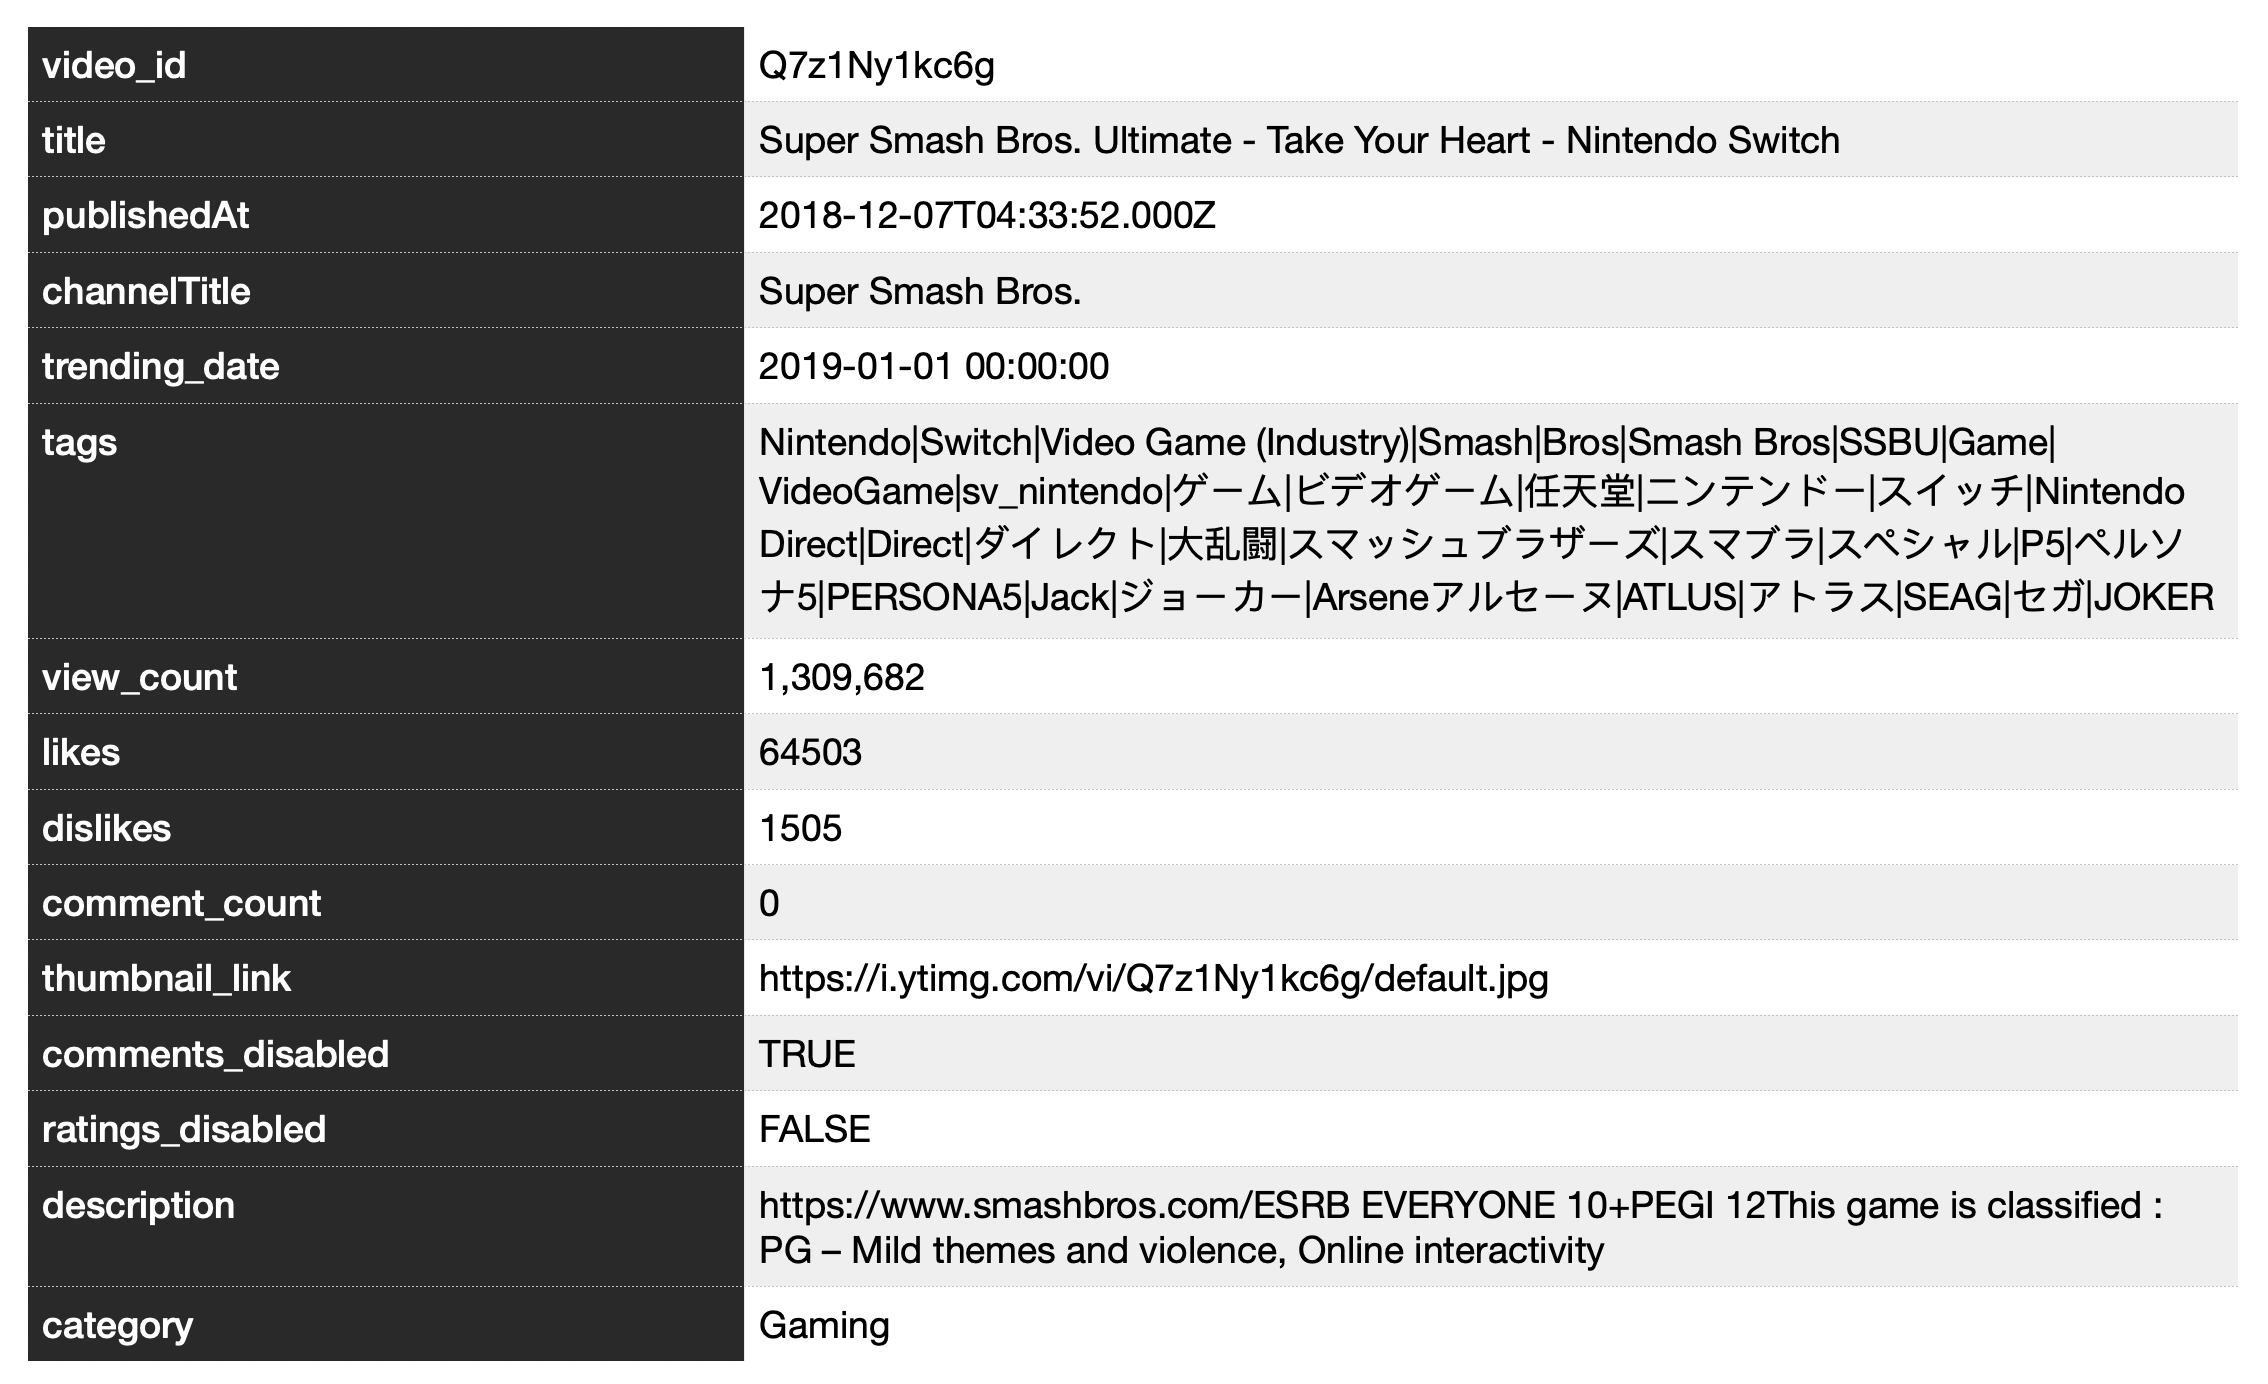
As we can see, we have the ID of the video which is a unique value for the video across YouTube (No two videos have the same ID). We also have the title of the video, its publishing date and time, the channel that published it, its category, and its description and tags. We also have the number of the views, likes, dislikes, and comments of the video. There are also a few more data shown in the table.
We can see that there is a field named “trending_date”. This field specifies the date on which this video was trending. As we said earlier, the same video might appear on the trending-videos list for more than one day. This means that we might find another record in the data for the same video ID but with different “trending_date” and maybe different number of views, comments, likes, etc. (because those numbers are likely to increase from one day to another).
If you want to download the data used in this analysis which describes 2019's trending videos in the United States, you can buy it securely on Gumroad on this link or by using the button below. Along with United States, you'll also get trending-videos data for United Kingdom, Canada, Denmark, Malaysia, Saudi Arabia, and other countries as well.
Analysis Results
Now let’s start the best part of this post, let’s see the analysis results.
Please note that for the following analyses, unless otherwise stated, we applied the analysis on all of the 72,994 trending videos, not on the unique trending videos only. The reasoning behind this is that we are interested in videos considered trending by YouTube. So if a video is considered trending for 3 days, then we believe that it has more trending power and more trending characteristics than a video that was trending for 1 day only; thus, it should have more weight. So we include the 3 occurrences of that video in the analysis.
For some analyses, considering only unique videos is more appropriate. When that is the case, you will see a note telling you about that.
Trending Videos and Views
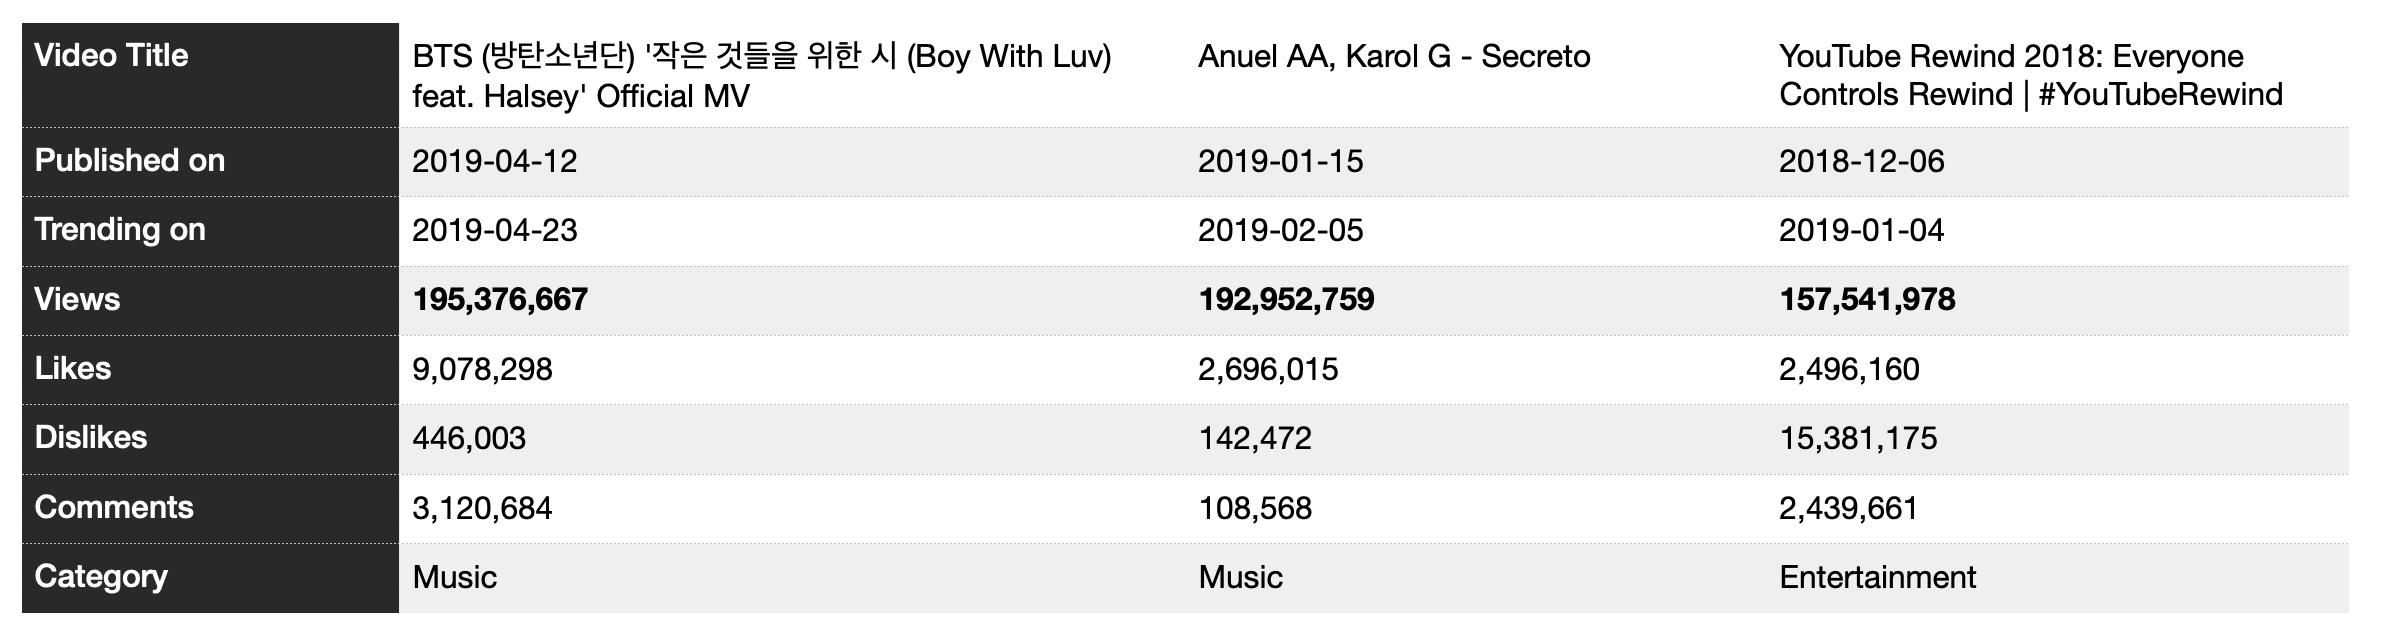
The Trending Video with the Highest Number of Views is a song by BTS band named “Boy With Luv”. The video was published on 12/April/2019 and on 23/04/2019, it appeared on the trending list with 195,376,667 views which is the highest number of views a trending video had in 2019.
In the table below, you can see the top 3 trending videos based on the number of views. These trending videos had views when they appeared on the trending list more than any other trending video. This table was produced by considering unique trending videos only (For more).
And now we will look at the distribution of views for trending videos. The histogram below shows this distribution:
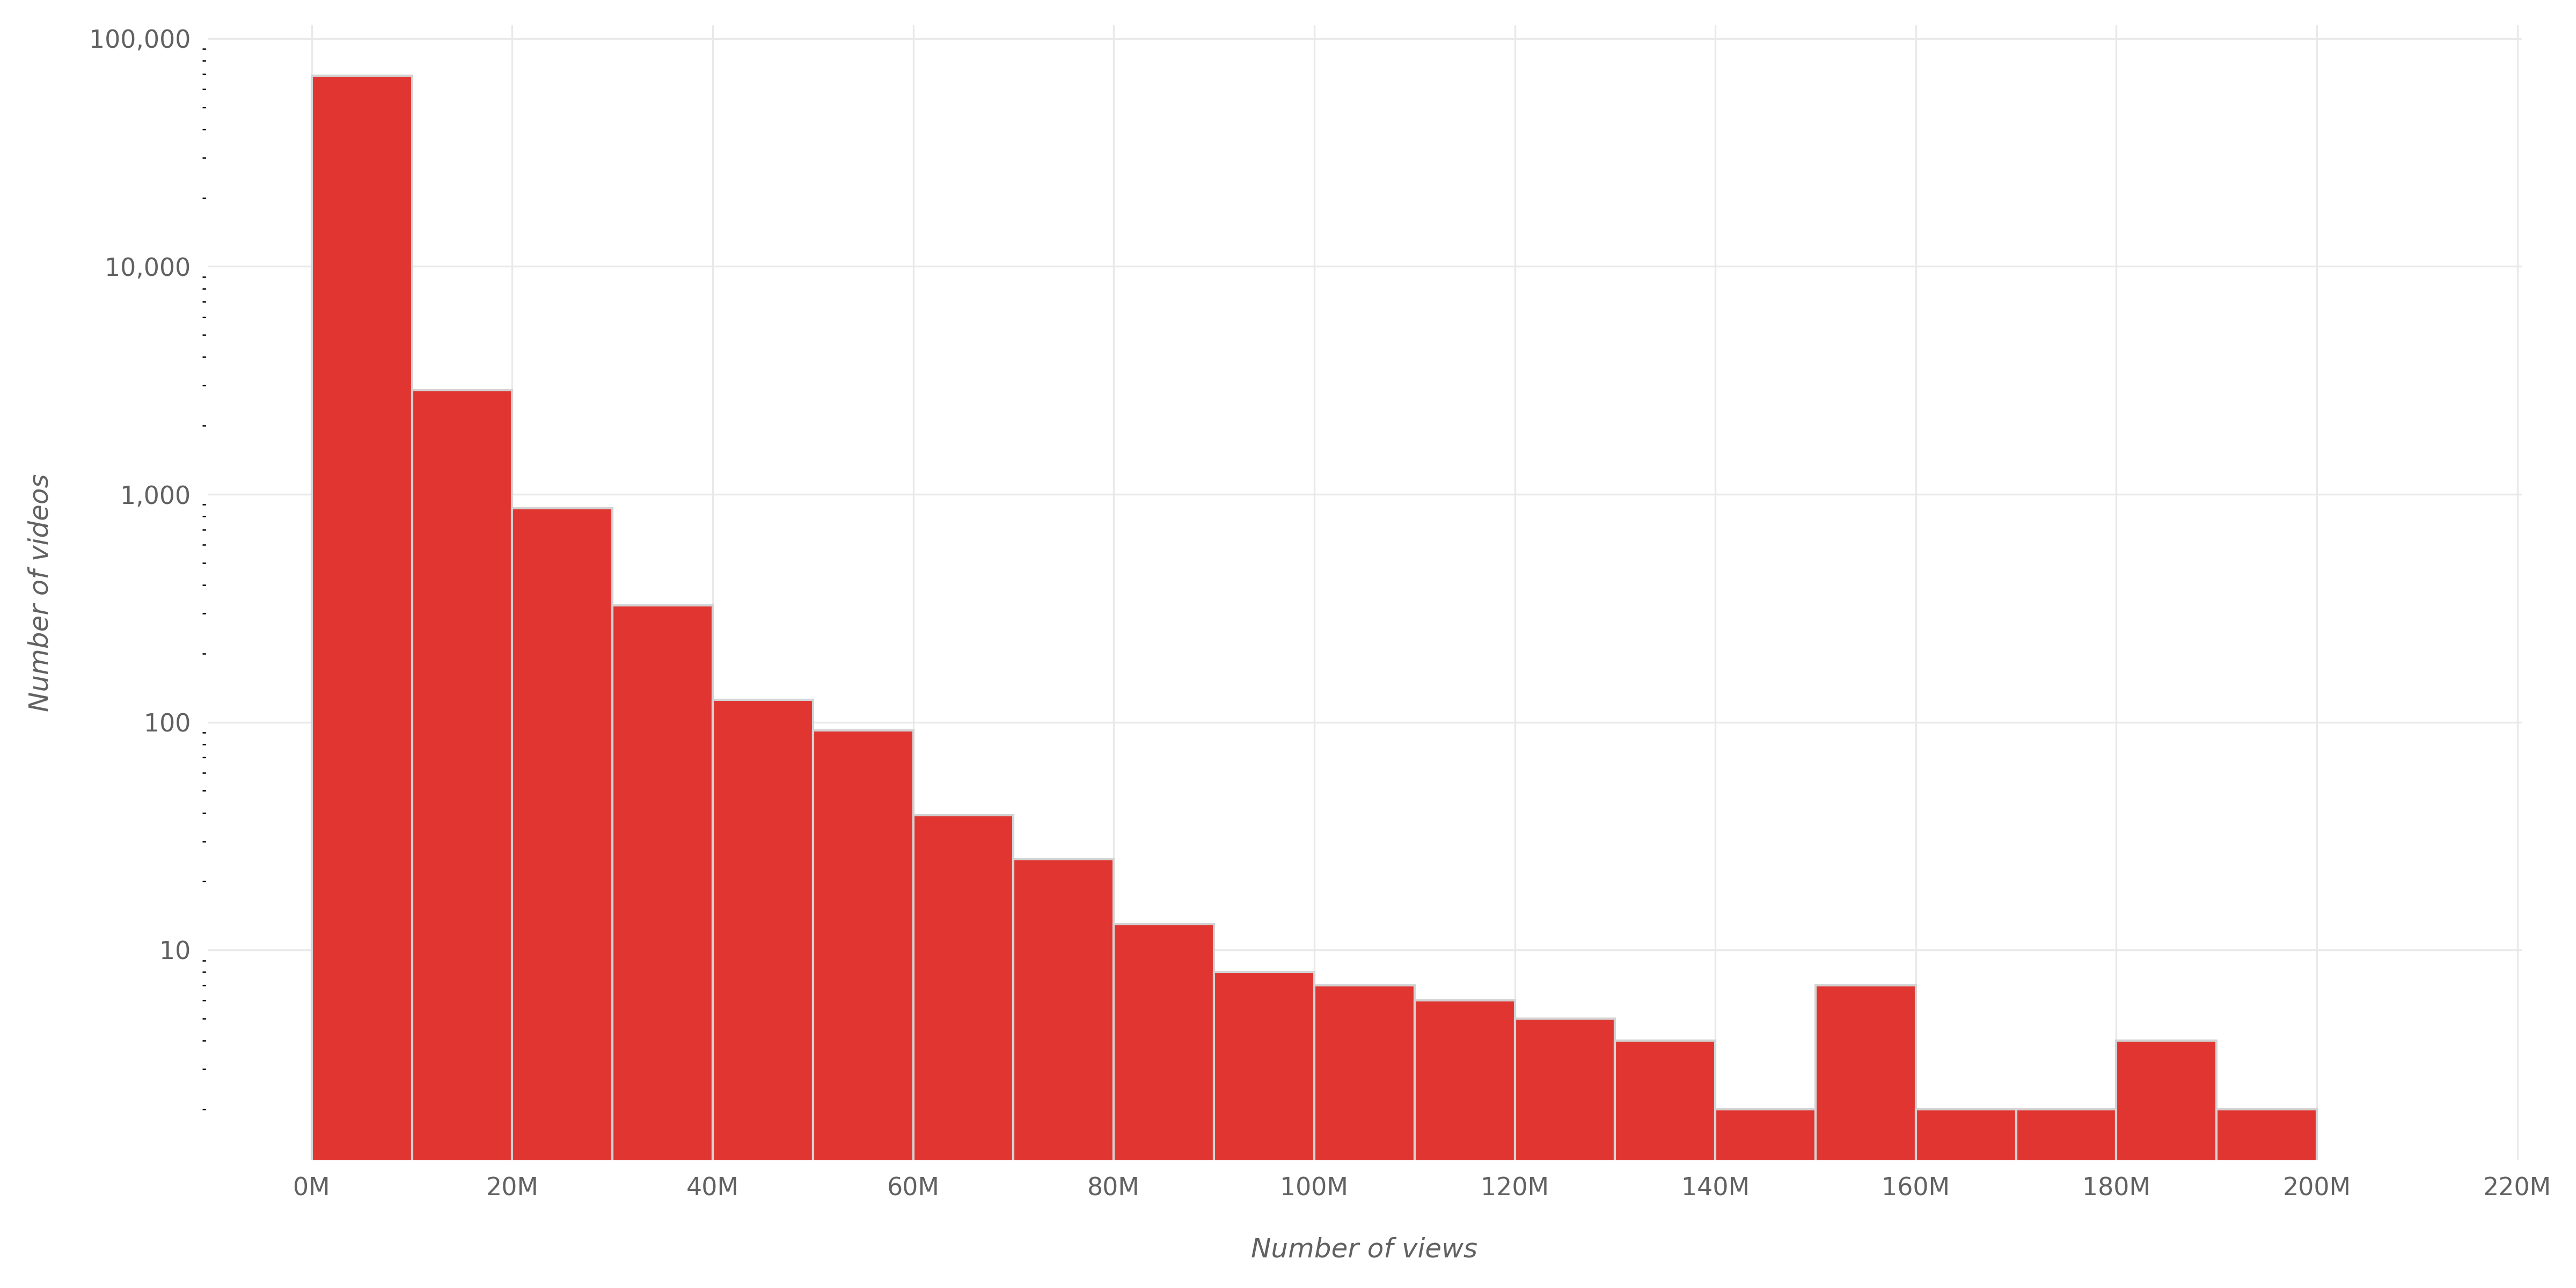
Notice that the y-axis is log scaled. It is 10, 100, 1000… not 10, 20, 30…
We can see that the vast majority of trending videos had less than 20 million views when they became trending. In fact, when they became trending, around 94% of trending videos had less than 10 million views and around 99.9% had less than 100 million views.
Now, we might ask: What are the trending videos with the least amount of views? The table below shows the 3 trending videos with the lowest number of views when appearing on the trending list. This table was produced by considering unique trending videos only (For more).
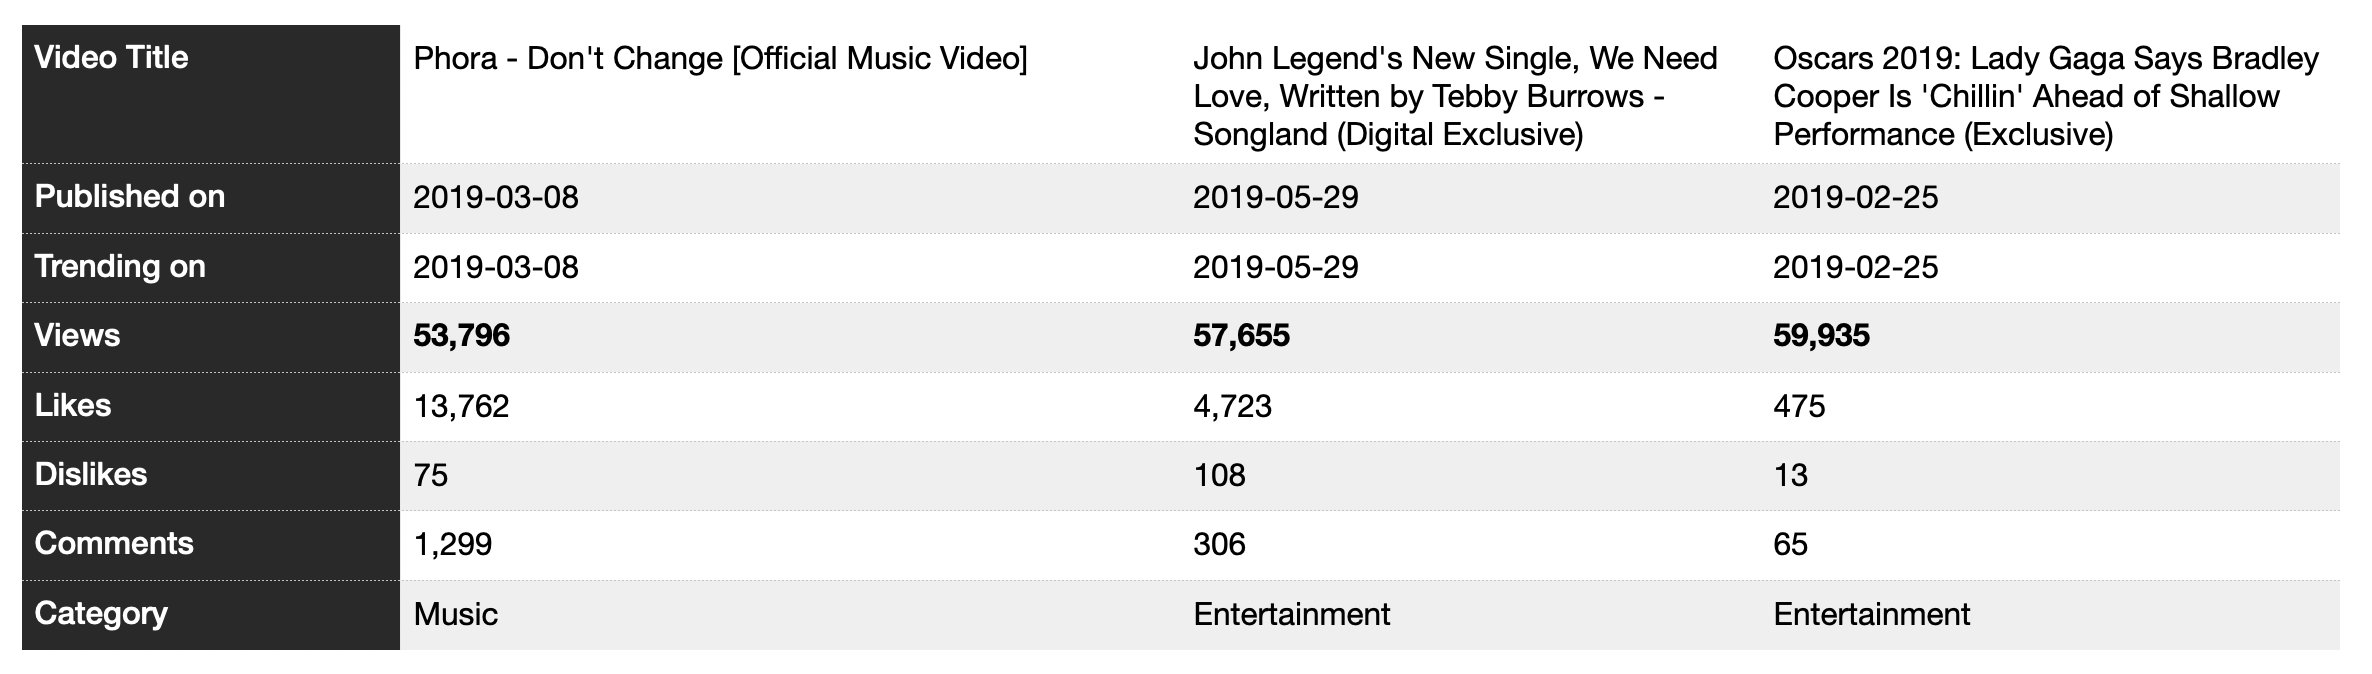
You can see that these three videos appeared on the trending list on the same day they were published on. Maybe they received a high number of views in the first few hours after they were published which sent them to the trending list.
How Many Views Videos Had When they First Became Trending?
We mentioned earlier that there were many videos that appeared on the trending list on more than one day. We now want to consider the first appearance only of each video. We want to know how many views a trending video had when it became trending for the first time.
The following graph shows the distribution of the number of views of trending videos when first appearing on the trending list:
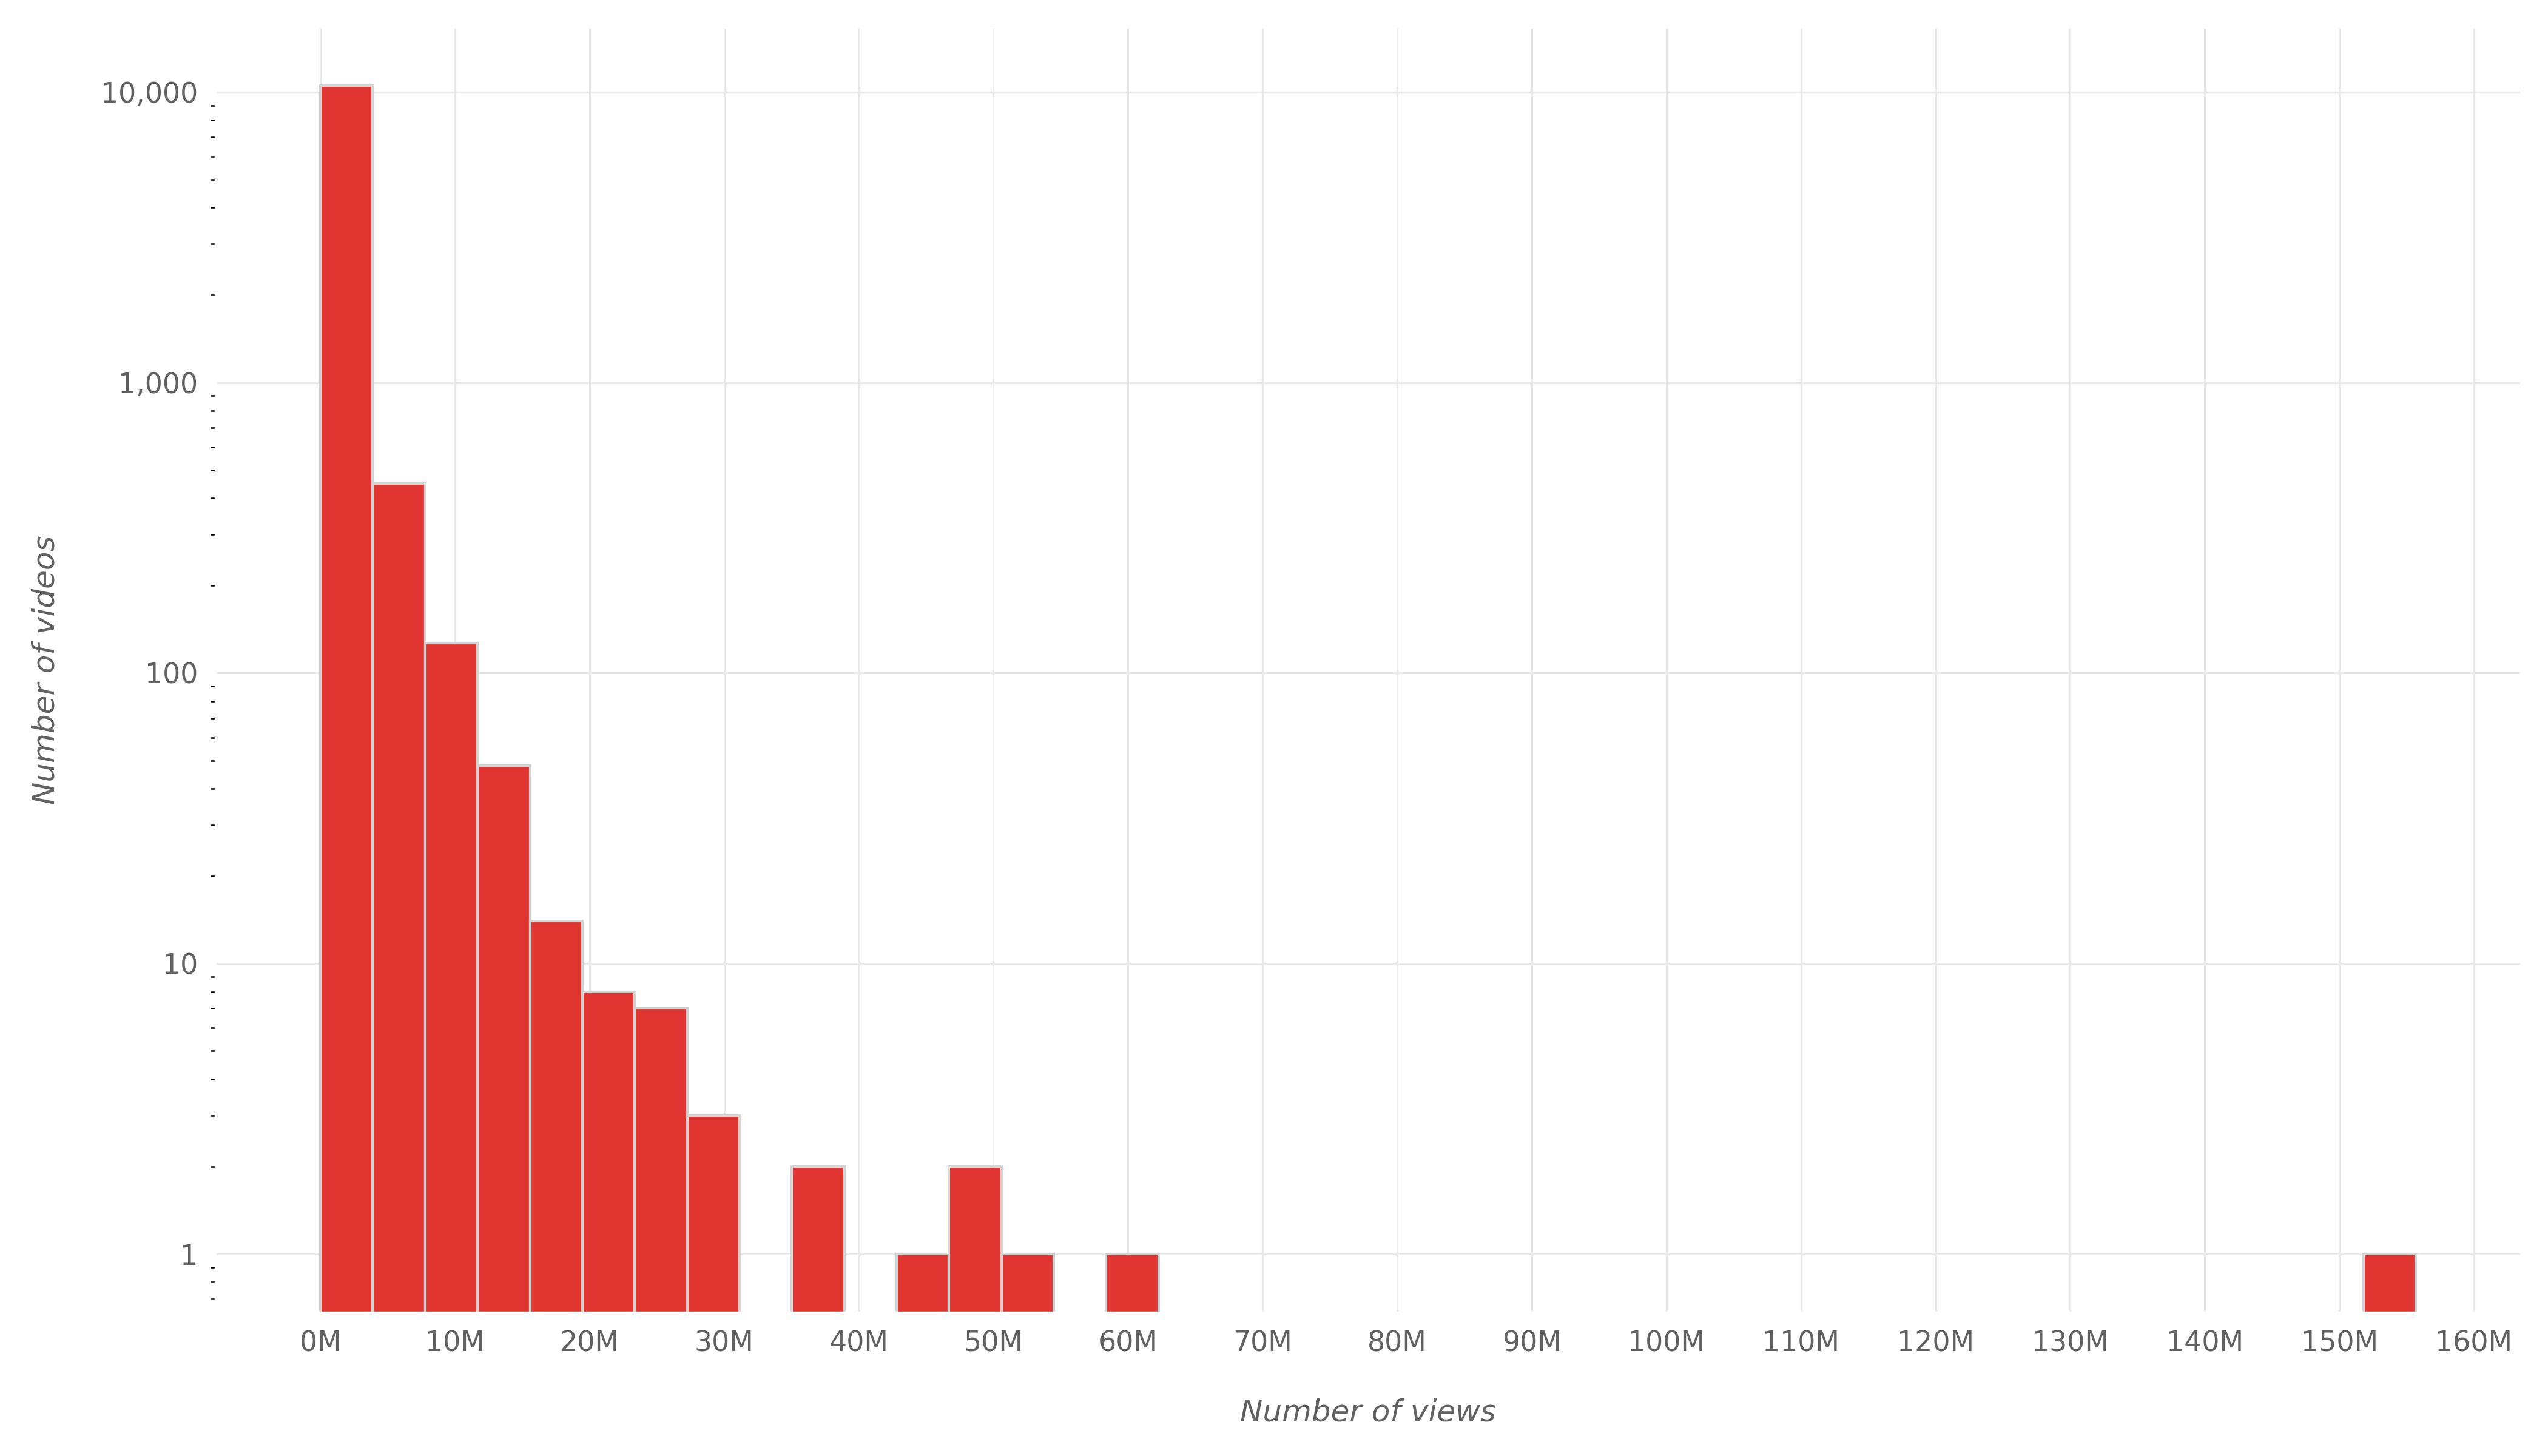
Notice that the y-axis is log scaled. It is 10, 100, 1000… not 10, 20, 30…
We can see that there is one video that became trending when it had ~150 million views. We can see another one that became trending when it had ~60 million views. But most of the videos became trending when they had less than ~30 million views.
In fact:
- 90% of trending videos became trending for the first time when they had less than 2,752,317 views.
- The minimum number of views a video had when it first became trending was 53,796 views.
- The average number of views a video had when it first became trending was 1,387,466 views. The median (the 50th percentile value) was 777,510 views.
Trending for 30 days!
Some videos don’t appear on the trending list for only one day, nor for two days. There are some videos that appeared on the trending list for 30 days. The following table shows the videos that appeared on the trending list the most. There are 6 videos that appeared for 30 days on the trending list.
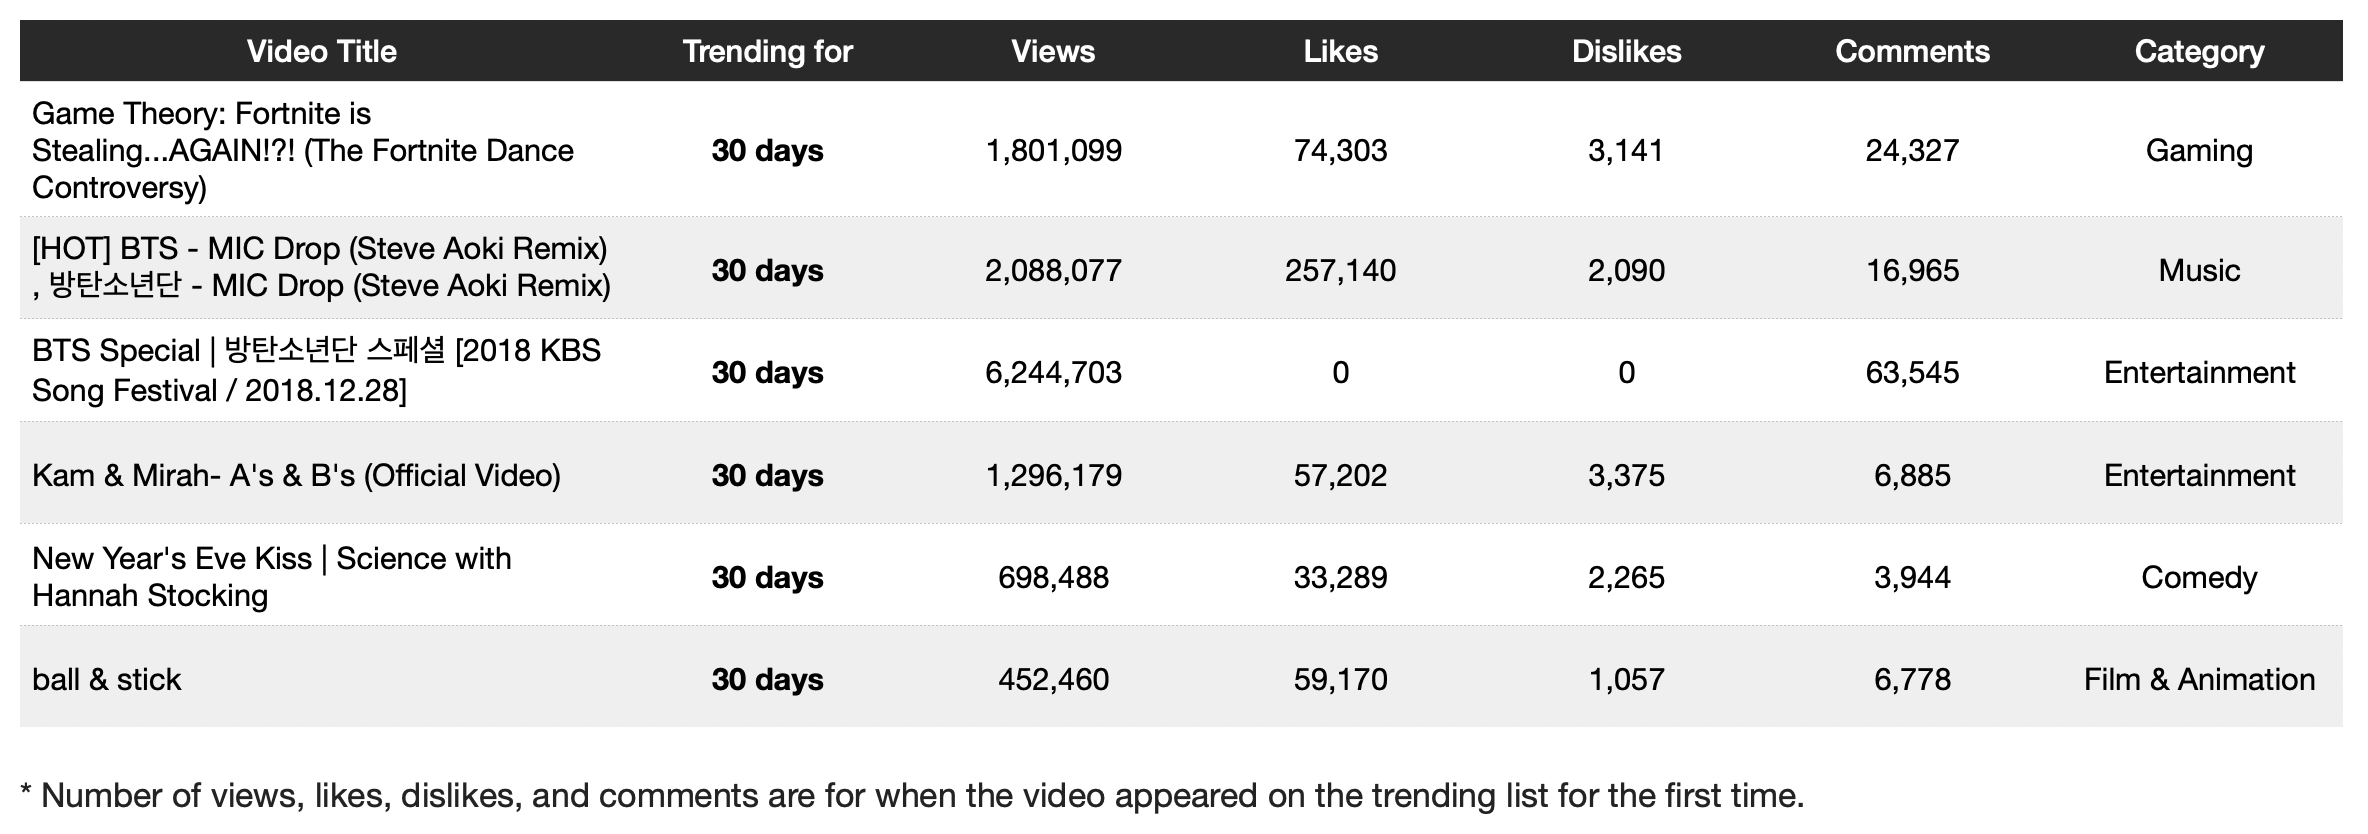
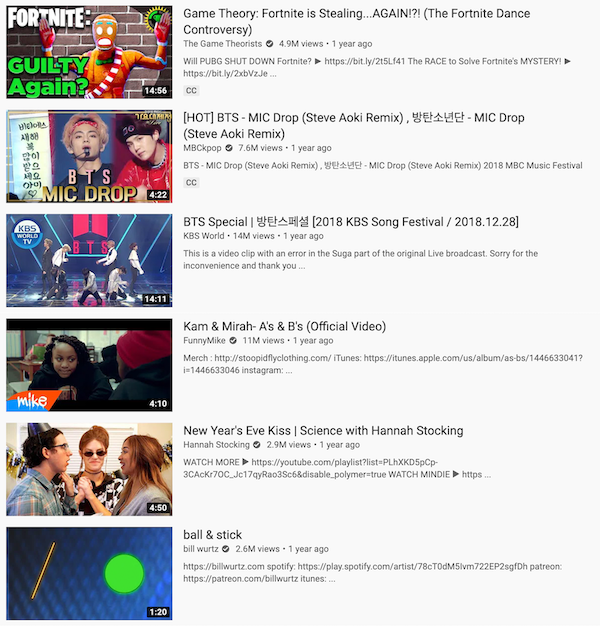
And this is how these 6 videos appear today on YouTube:
Trending Videos Titles
Titles constitute an important part of each video. They describe the video for people before deciding to click on the video or not. And because of that, video title is one of the important factors in video success; video title plays an essential role in determining video click-through-rate (CTR). Here are some interesting facts about 2019’s trending-videos titles.
6% of trending-videos titles are fully uppercase (LIKE THIS). Numbers, symbols, and emojis are not taken into account for this. For example, all the following titles are considered fully uppercase: “FIRST TITLE”, “2ND TITLE”, “#3 TITLE 🎉”.
Number of Fully-Uppercase Words in Titles
If we count the number of fully-uppercase words in each of the trending-videos titles we get the following distribution graph:
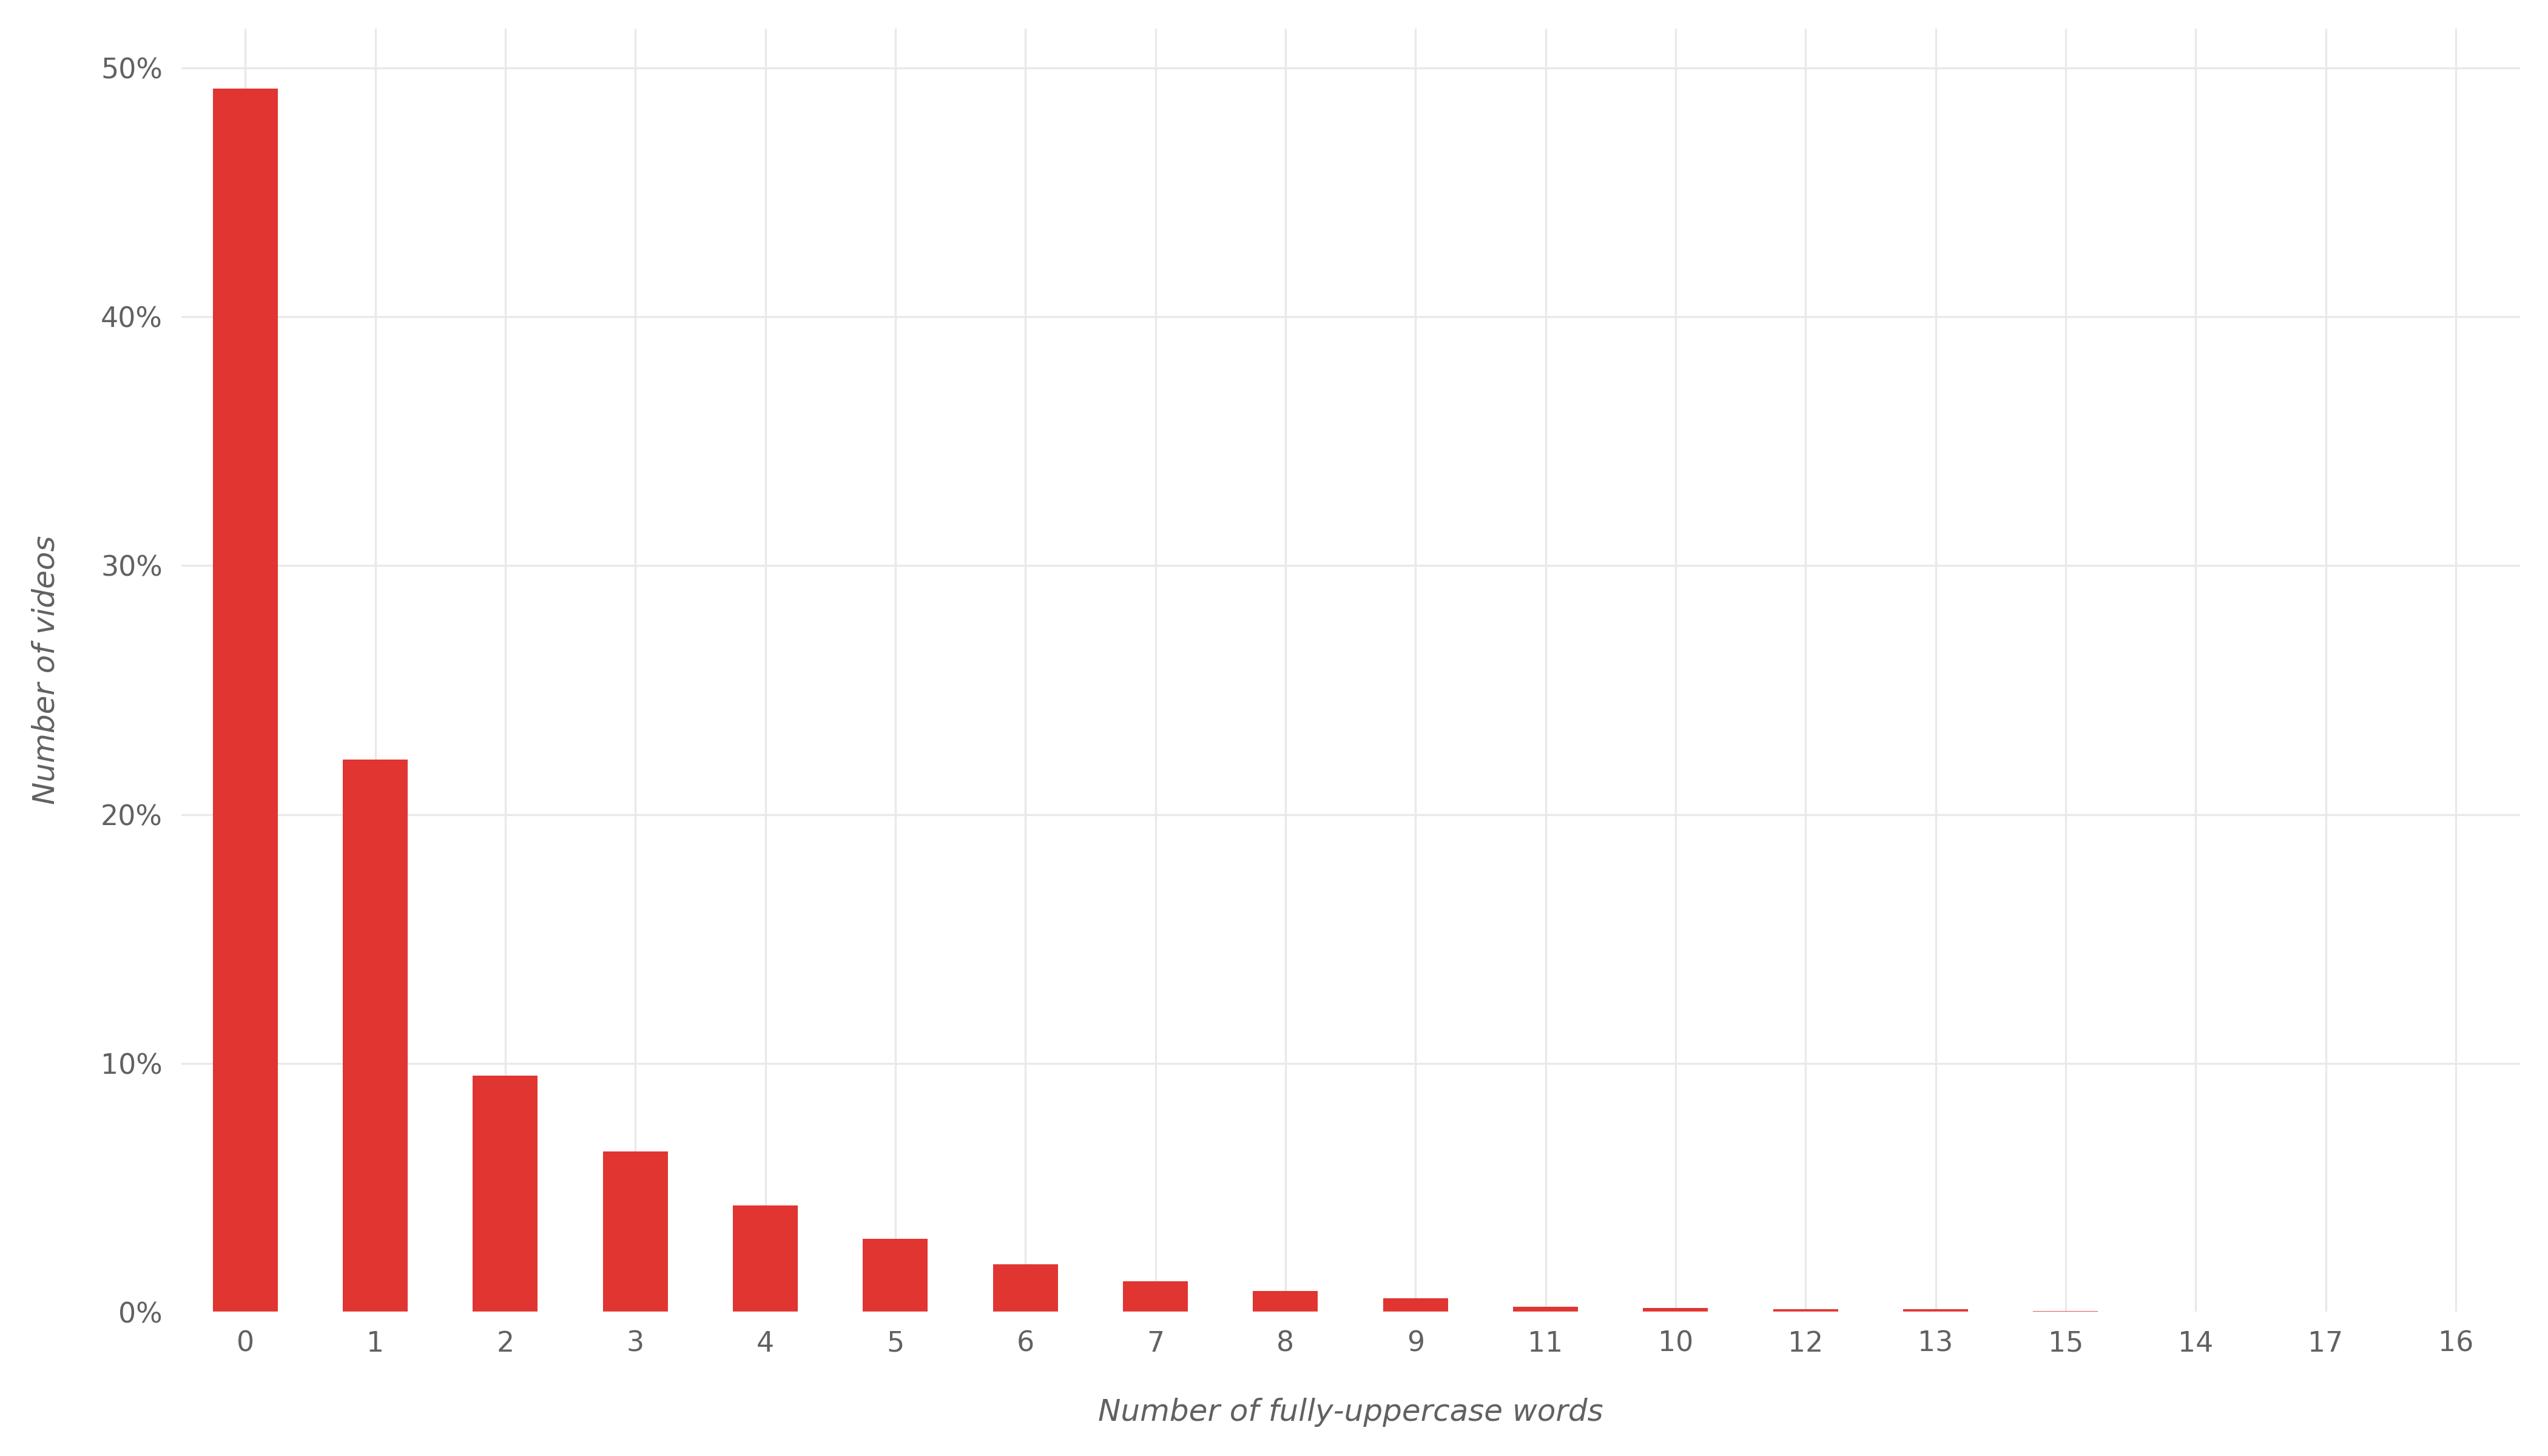
This means that around 50% of trending videos have no fully-uppercase word in their titles, around 20% have 1 fully-uppercase word in their titles, around 10% have 2 fully-uppercase words in their titles, etc.
What are the Most Common Words in Video Titles?
Are there some words that occur in trending video titles more than others? To find out the answer, I analyzed the titles of all trending videos and counted the occurrences of each word in those titles. Before that, symbols were removed from the words and contractions were replaced with their expansions. For example, “aren’t” and “we’ll” were replaced with “are not” and “we will” respectively.
Here is a word cloud of the most common 100 words in the trending titles. The size of the word reflects how common it is:
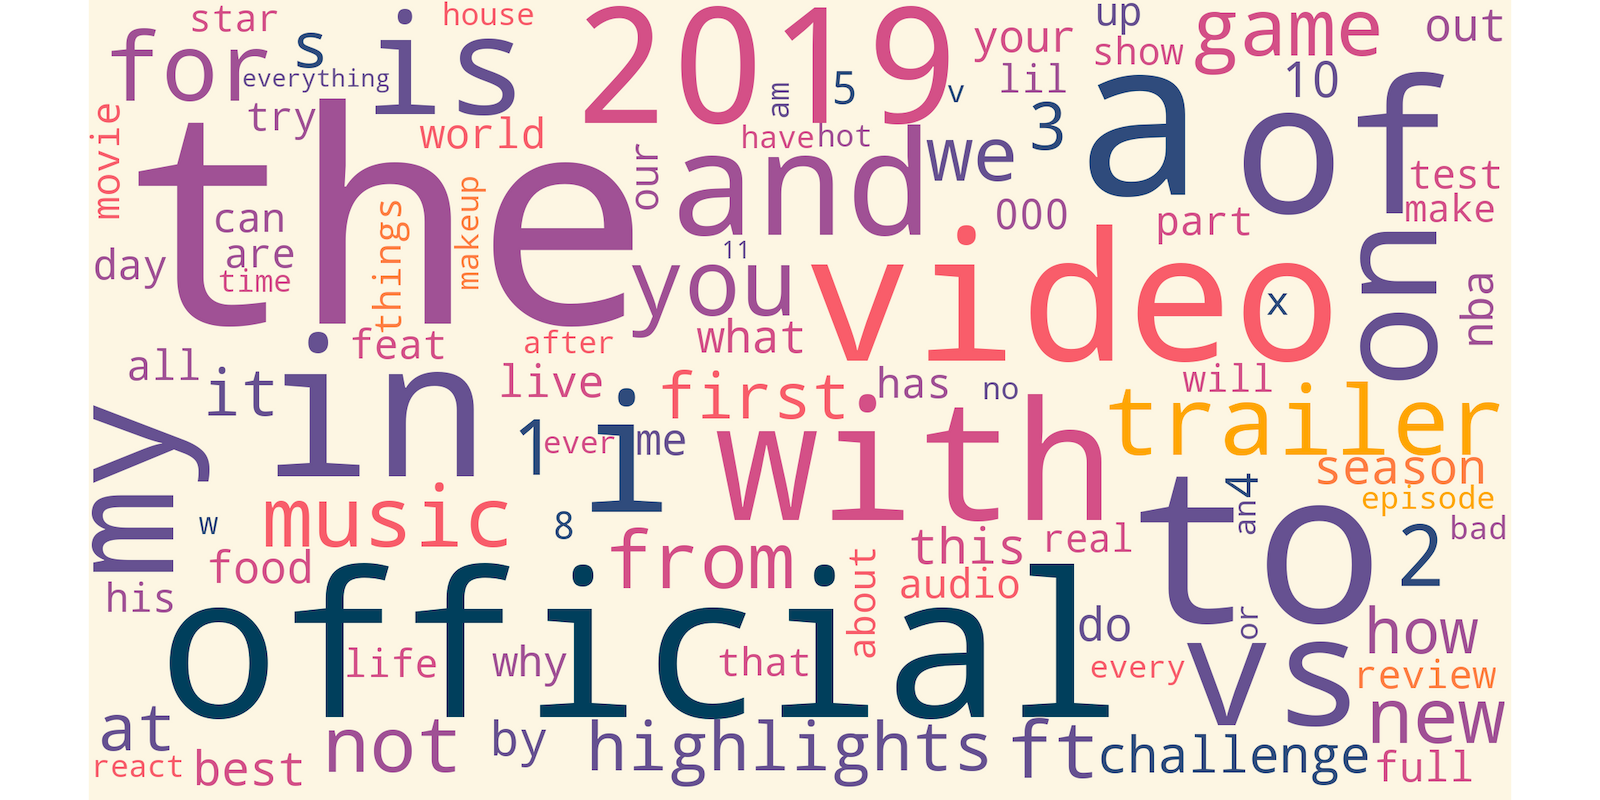
You can see that the most common word is “the” because it is the largest. You can also see large “a”, “to”, and “in”. Such words are called stop words. Stop words are words that are very common in a given language (English in our case). To get better results, we will exclude stop words from our analysis.
After excluding stop words, we get this word cloud:
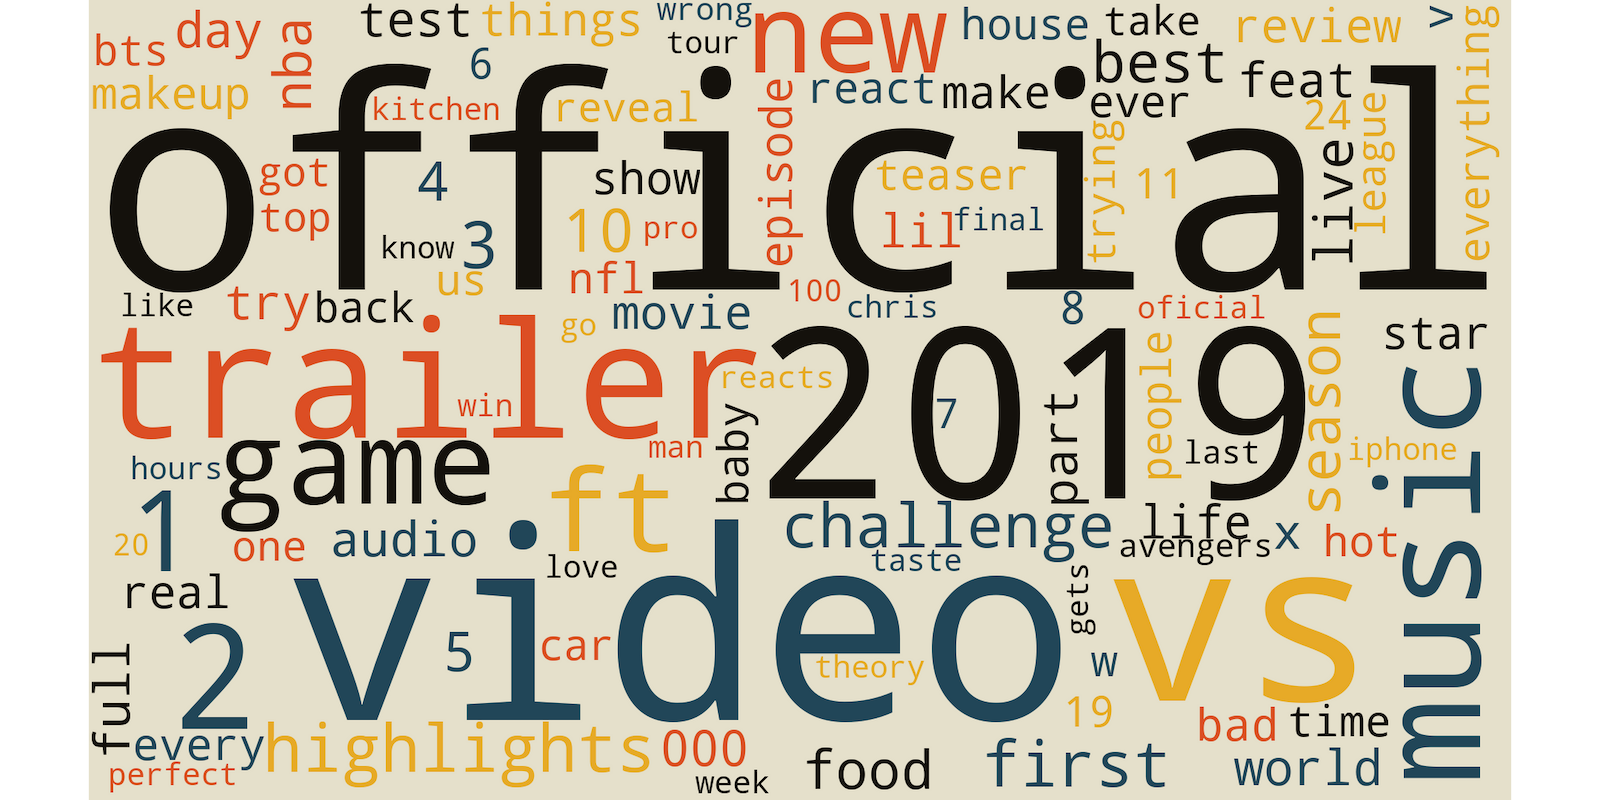
We can now see more meaningfully the most common words in trending-videos titles. To see the exact commonness (frequency) values, the following table shows the most common 15 words with their frequencies:
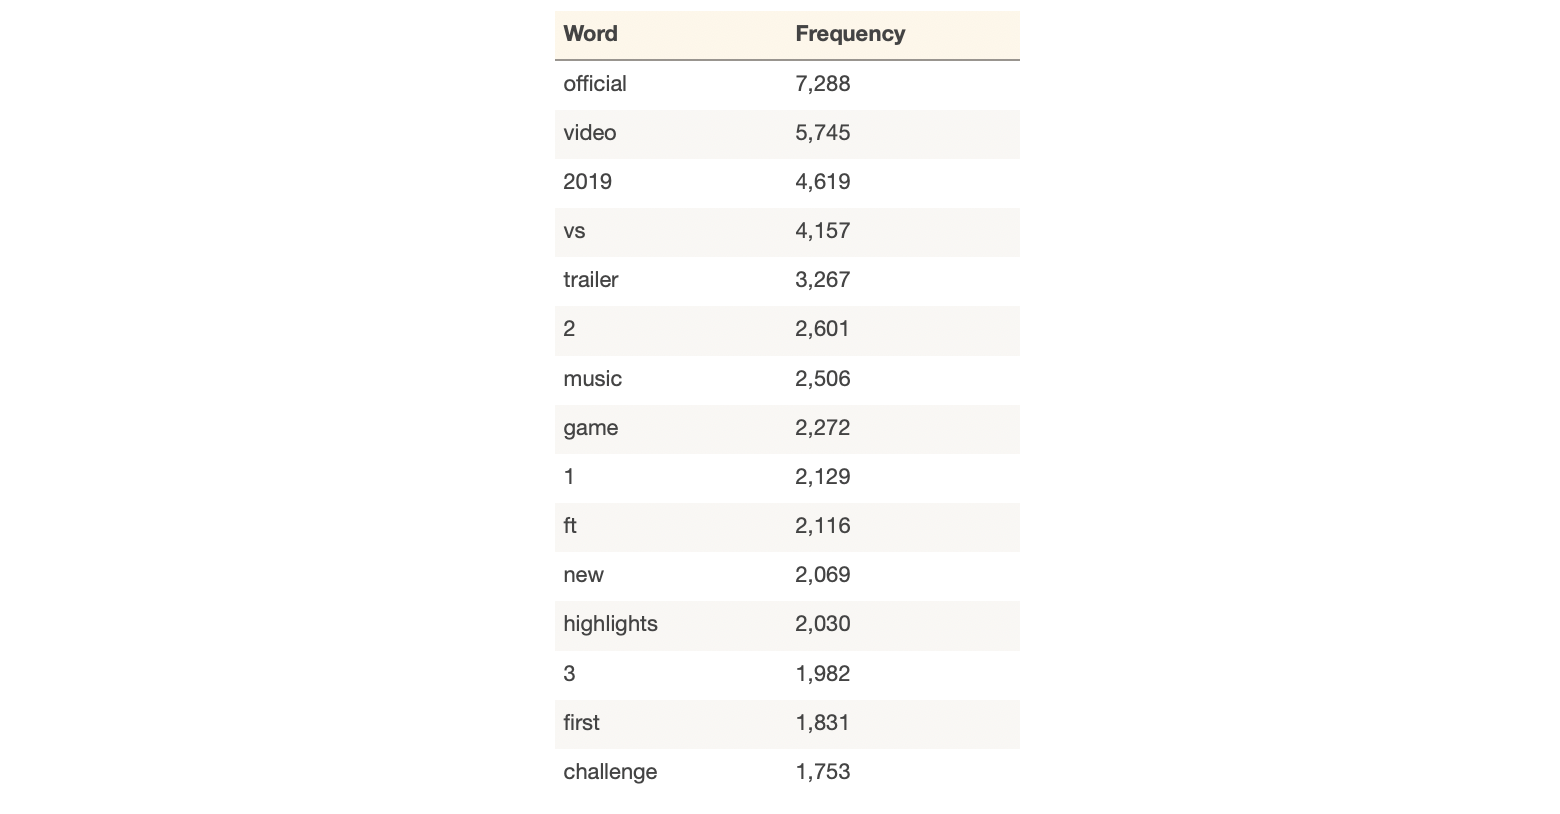
For more details on the process, method used for word tokenization, stop words specifications, etc., please review the code in the project notebook.
Now let’s see what are the most common symbols in the titles of trending videos. Previously, we ignored symbols to produce the word clouds above. Now, we will consider only symbols. The table below shows the most common symbols:
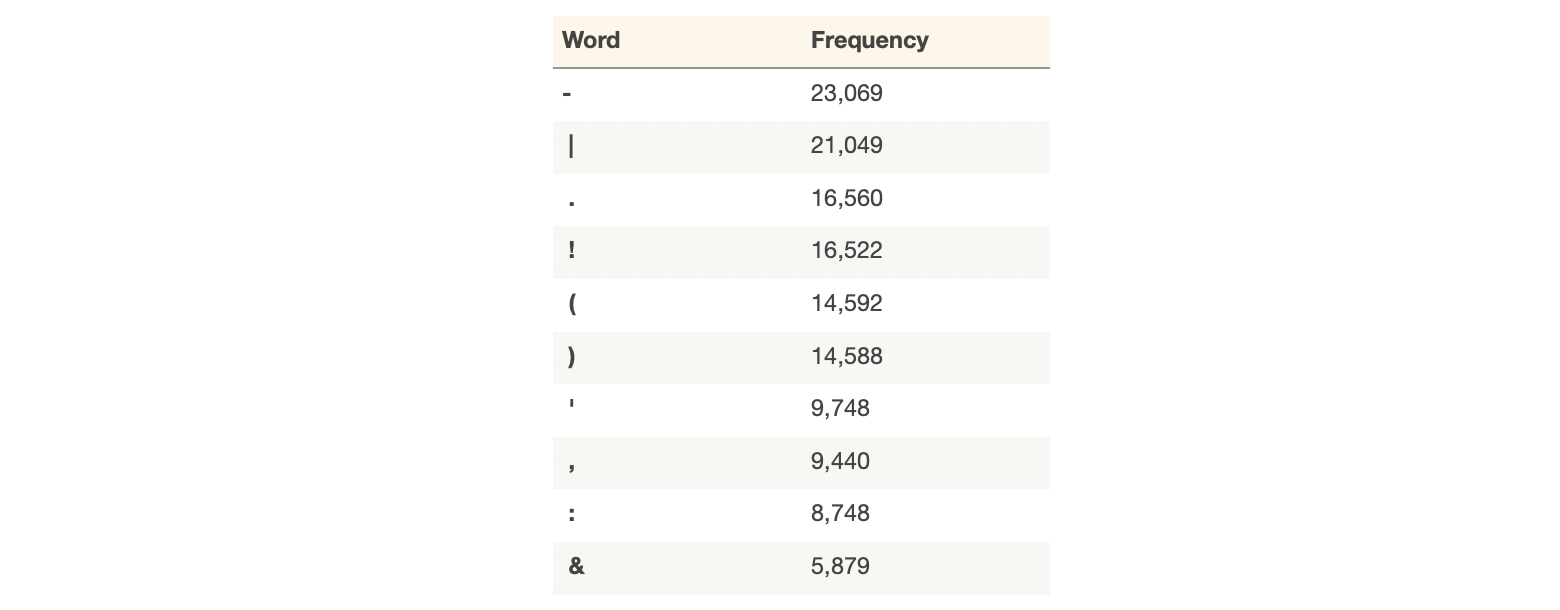
We can see that “-” is the most occurring symbol. It occurred around 23,000 times in trending titles. After that comes the pipe “|” which occurred around 21,000 times in trending titles. Then we find “.” which occurred 16,560 time.
Now considering only emoji symbols, let’s see the most common emojis in the titles of trending videos:

So 🔥 is the most common with frequency of 154 followed by ™️ then ®.
What are the Most Common 2-Grams in Video Titles?
But first, what are 2-grams? A 2-gram is a sequence of 2 words. For example, if we have the following sentence: “How are you today?”, then we can extract three 2-grams out of it: “How are”, “are you”, “you today?”.
If we extract the 2-grams from all trending-videos titles, what will be the most common ones? The word cloud below answers this question. Notice that the words of each 2-gram are connected with a “-“.
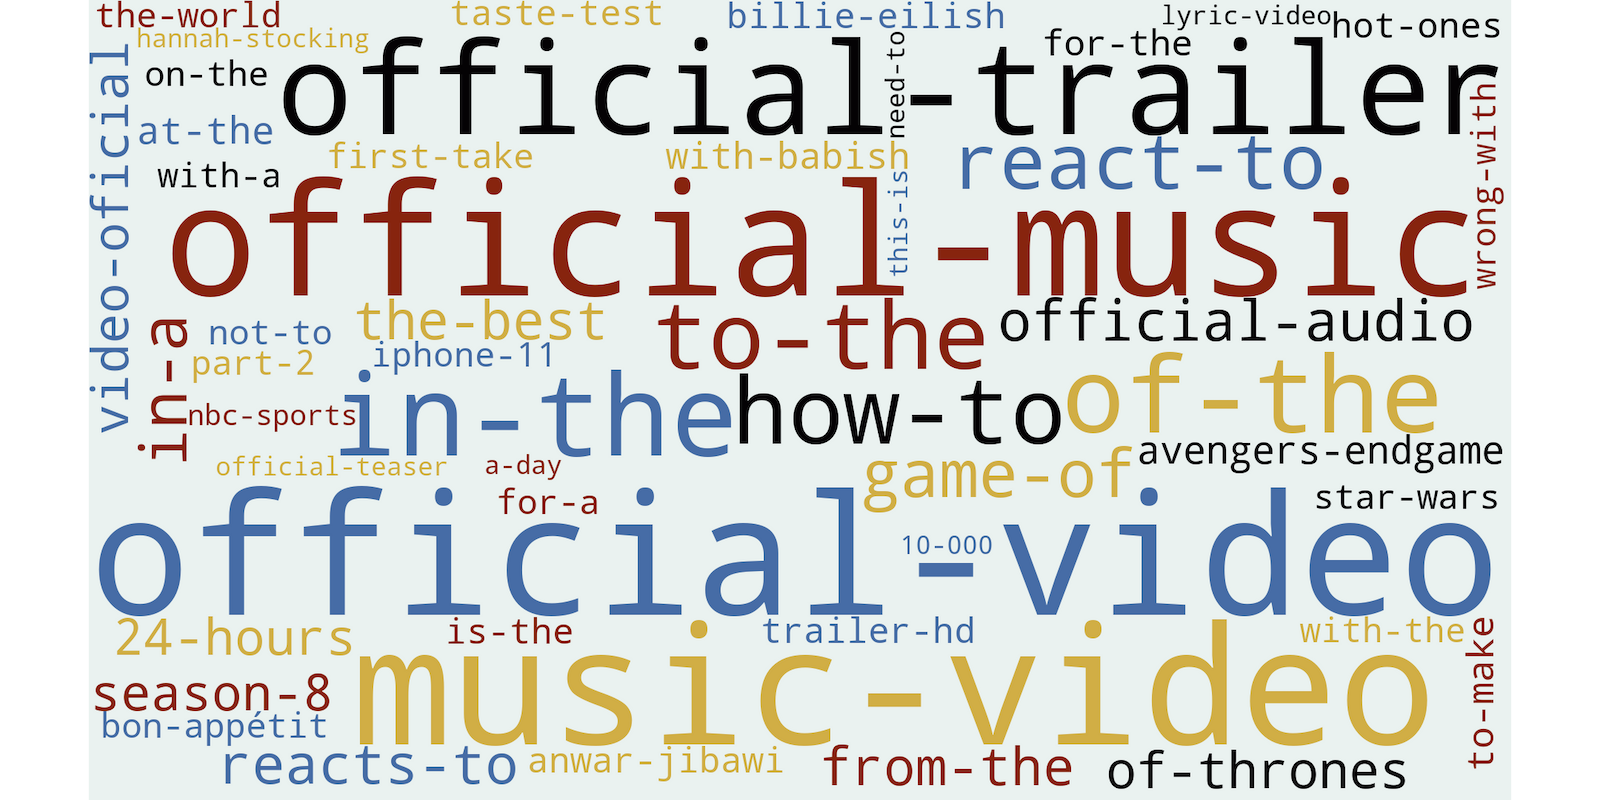
And the following table shows the exact frequencies of the 5 most-common 2-grams:

In the word cloud, we can identify some trends: we can see “reacts to”, “react to”, “avenger endgame”, “star wars”, “anwar jibawi”, etc.
Titles Lengths
How long are trending-videos titles? The following box plot answers this question by showing the distribution of titles lengths.
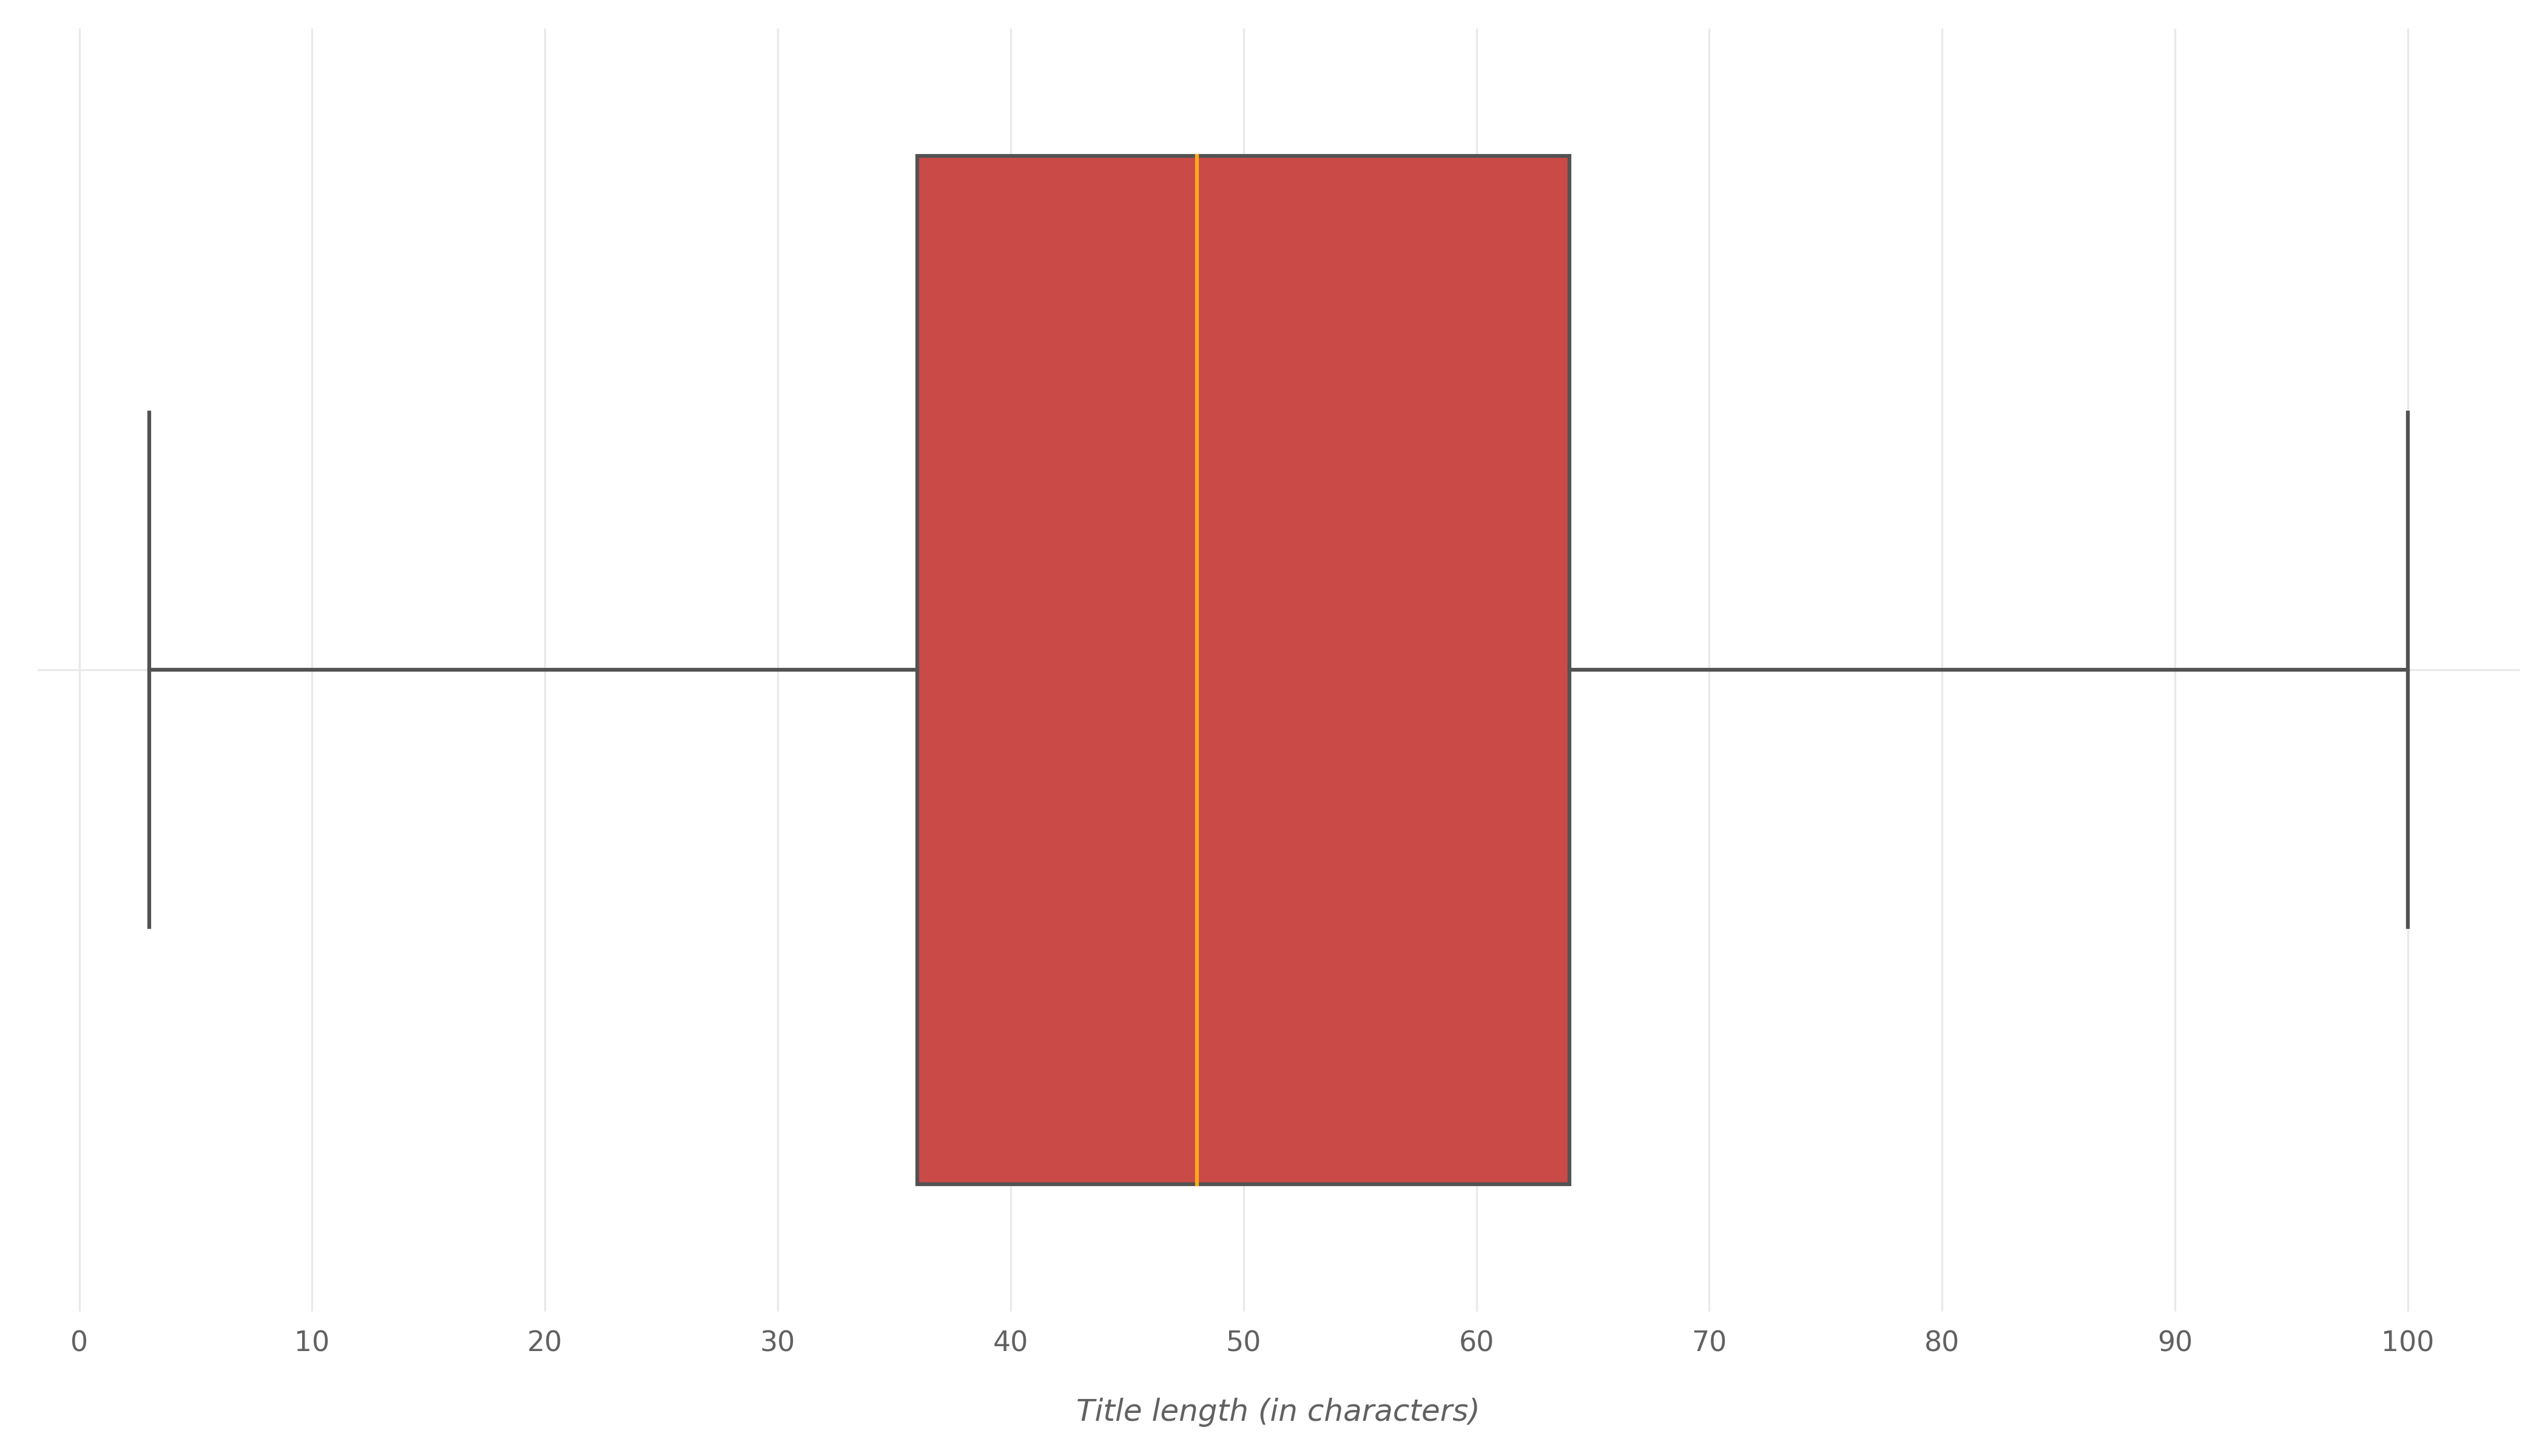
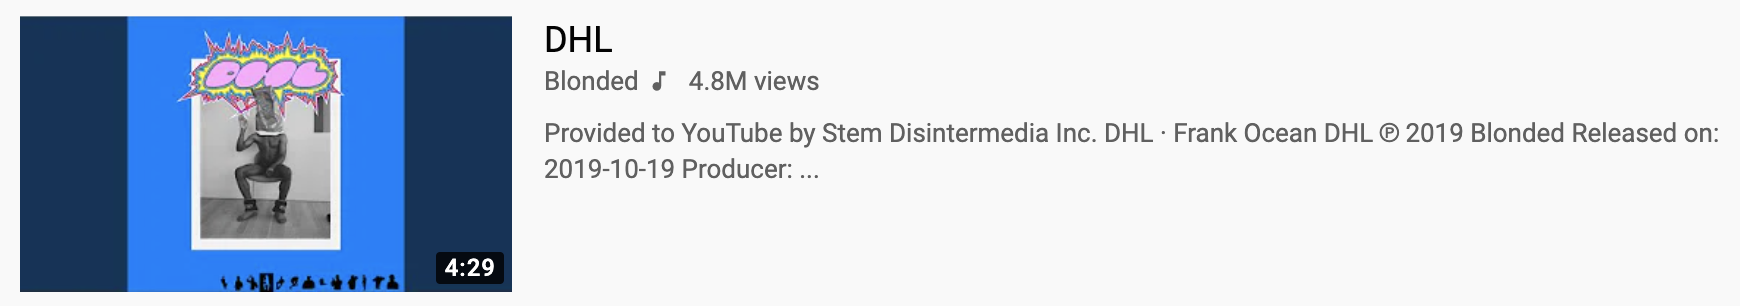
We can see that most trending videos have a title length between 36 and 64 characters. The average title length is 51 characters. The maximum title length is 100 which is the maximum title limit on YouTube and the minimum title length is 3. There is, actually, one video with a title length of 3 which is this video titled “DHL” which appeared on the trending list for 7 days:
Trending Channels
Which channels produced more trending videos? The following bar chart tells us the answer:
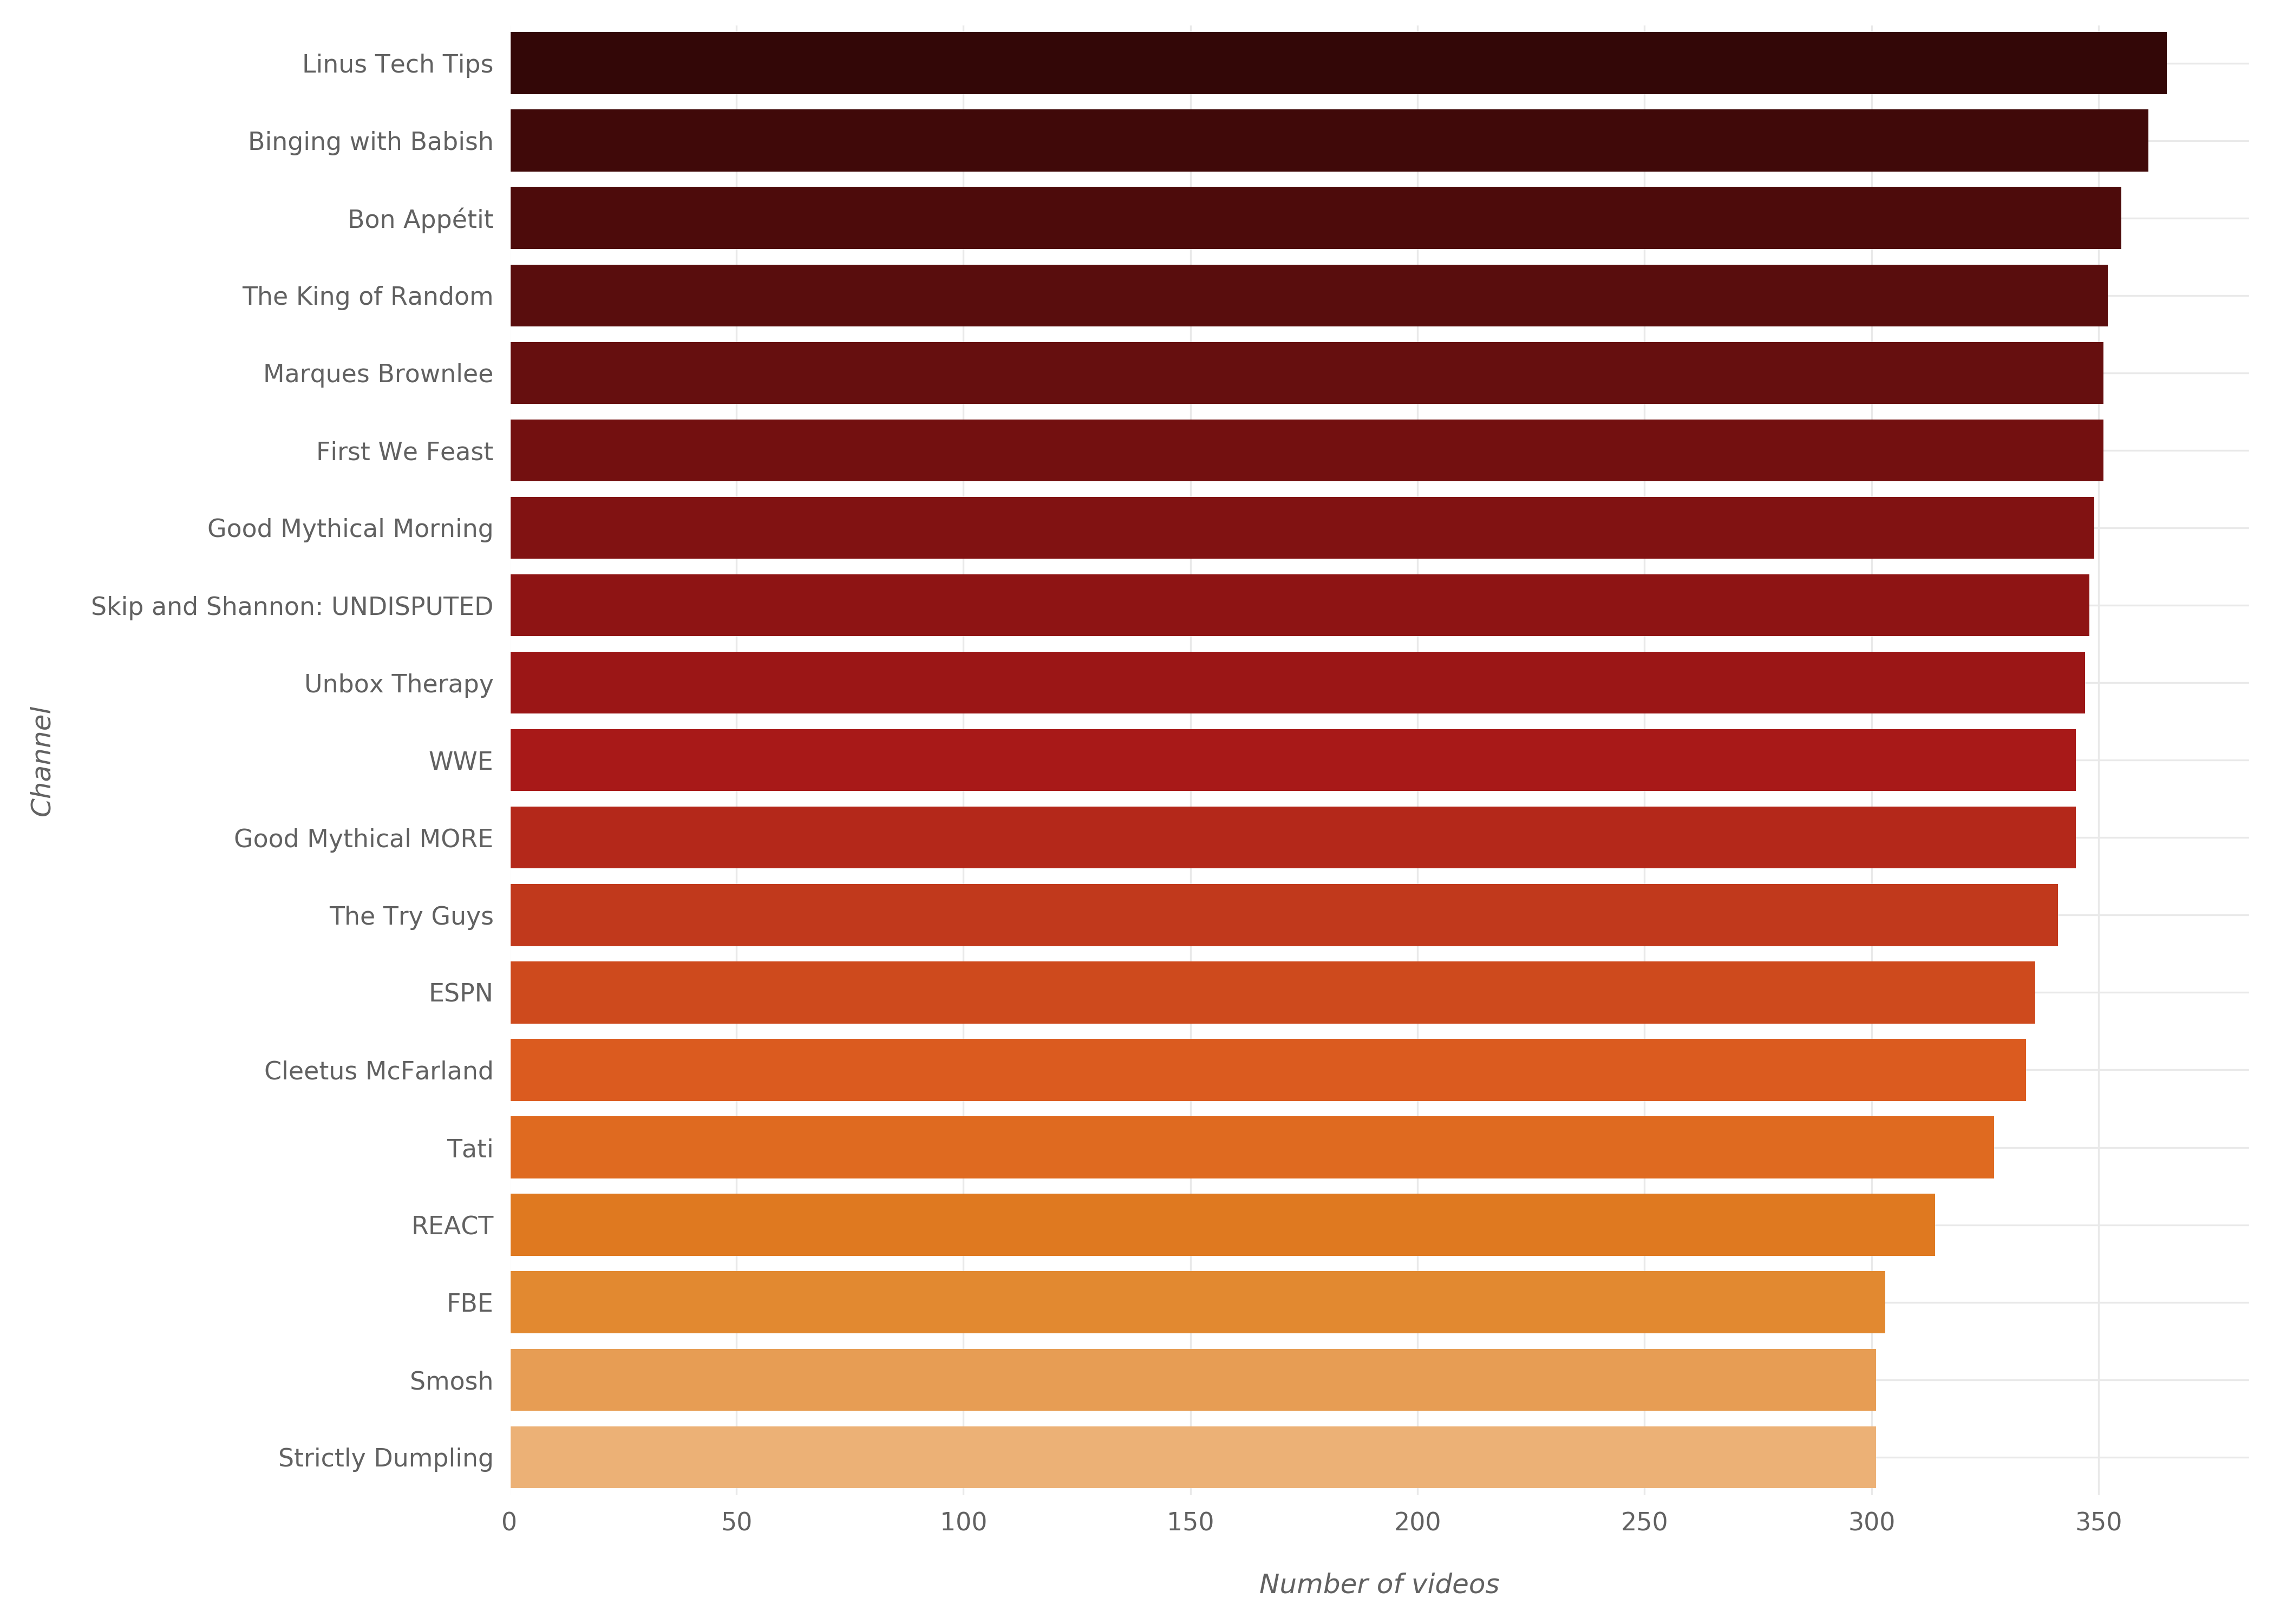
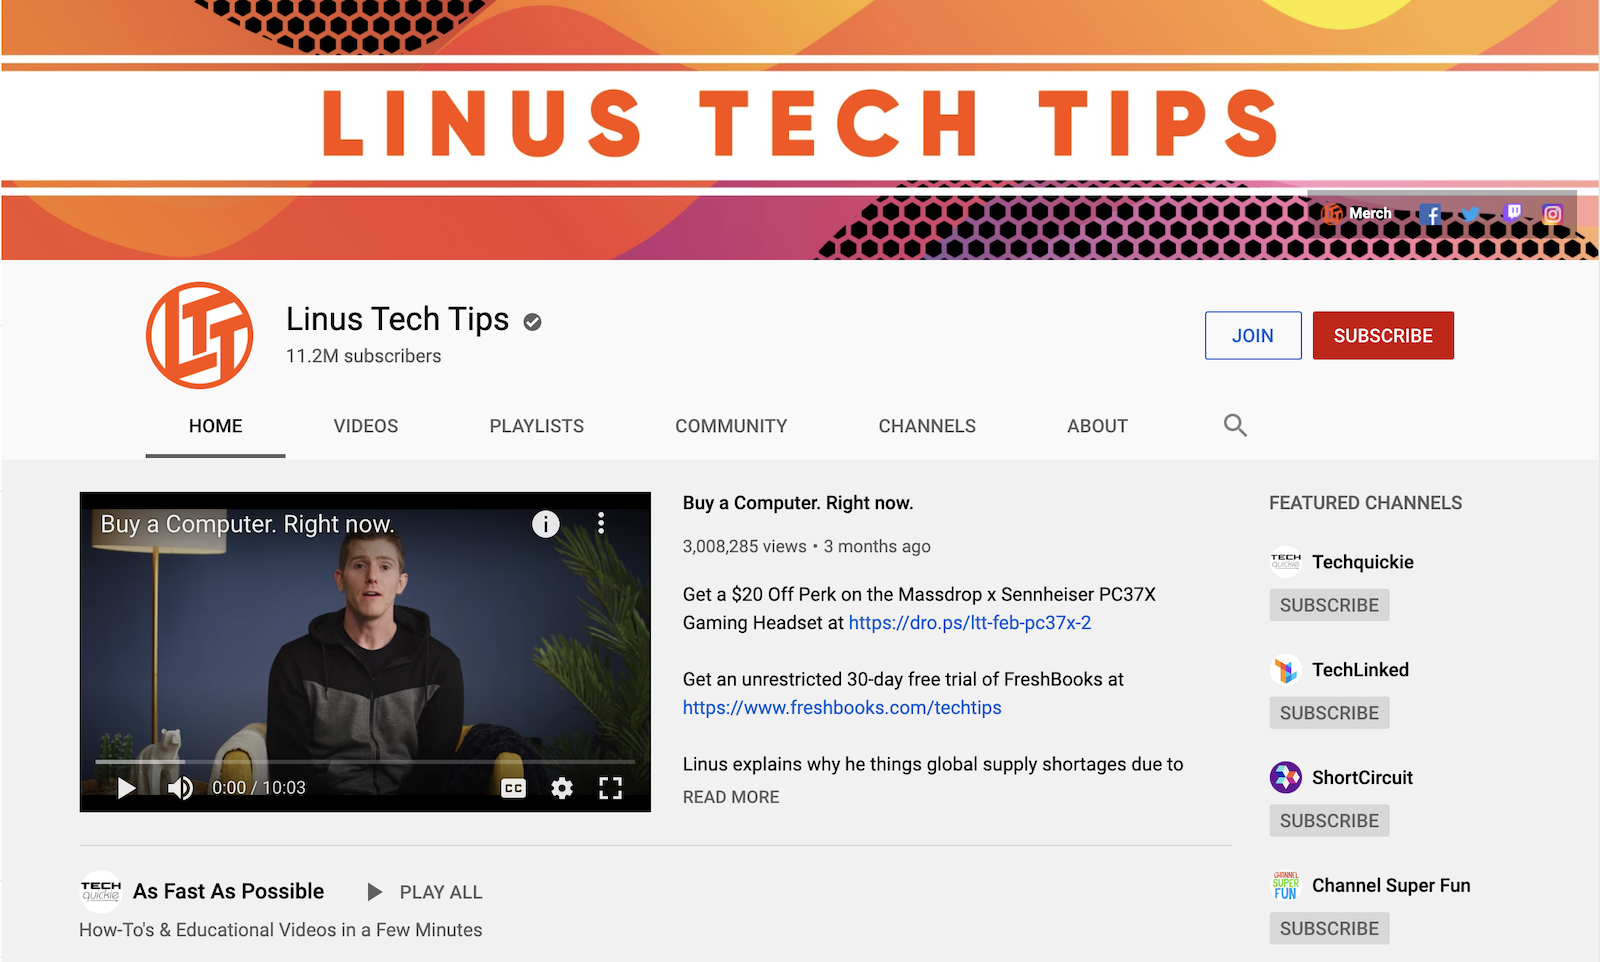
We can see that Linus Tech Tips is the channel with most trending videos (365 videos). And the surprise is that it is a technology channel! This channel started in 2008 and has now (22/June/2020) 5,018 published videos. This is how it looks now:
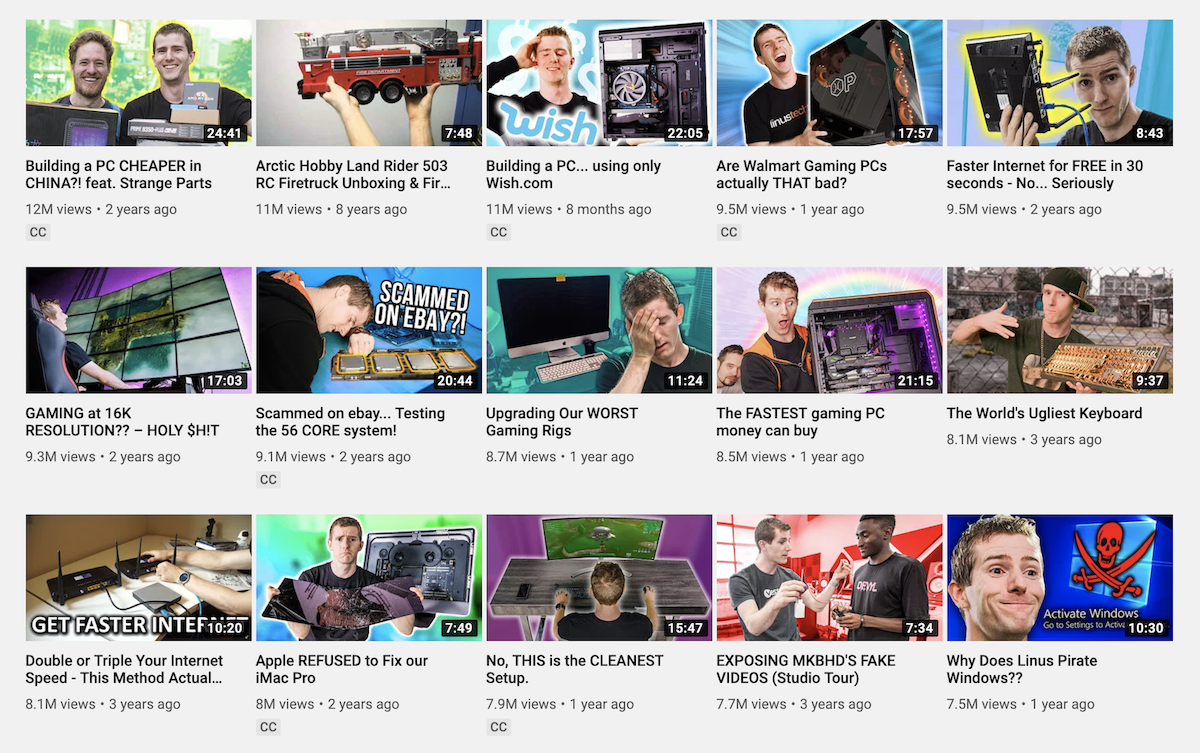
And these are their most popular videos as of now:
And this is how their first video looked like back in 2008:

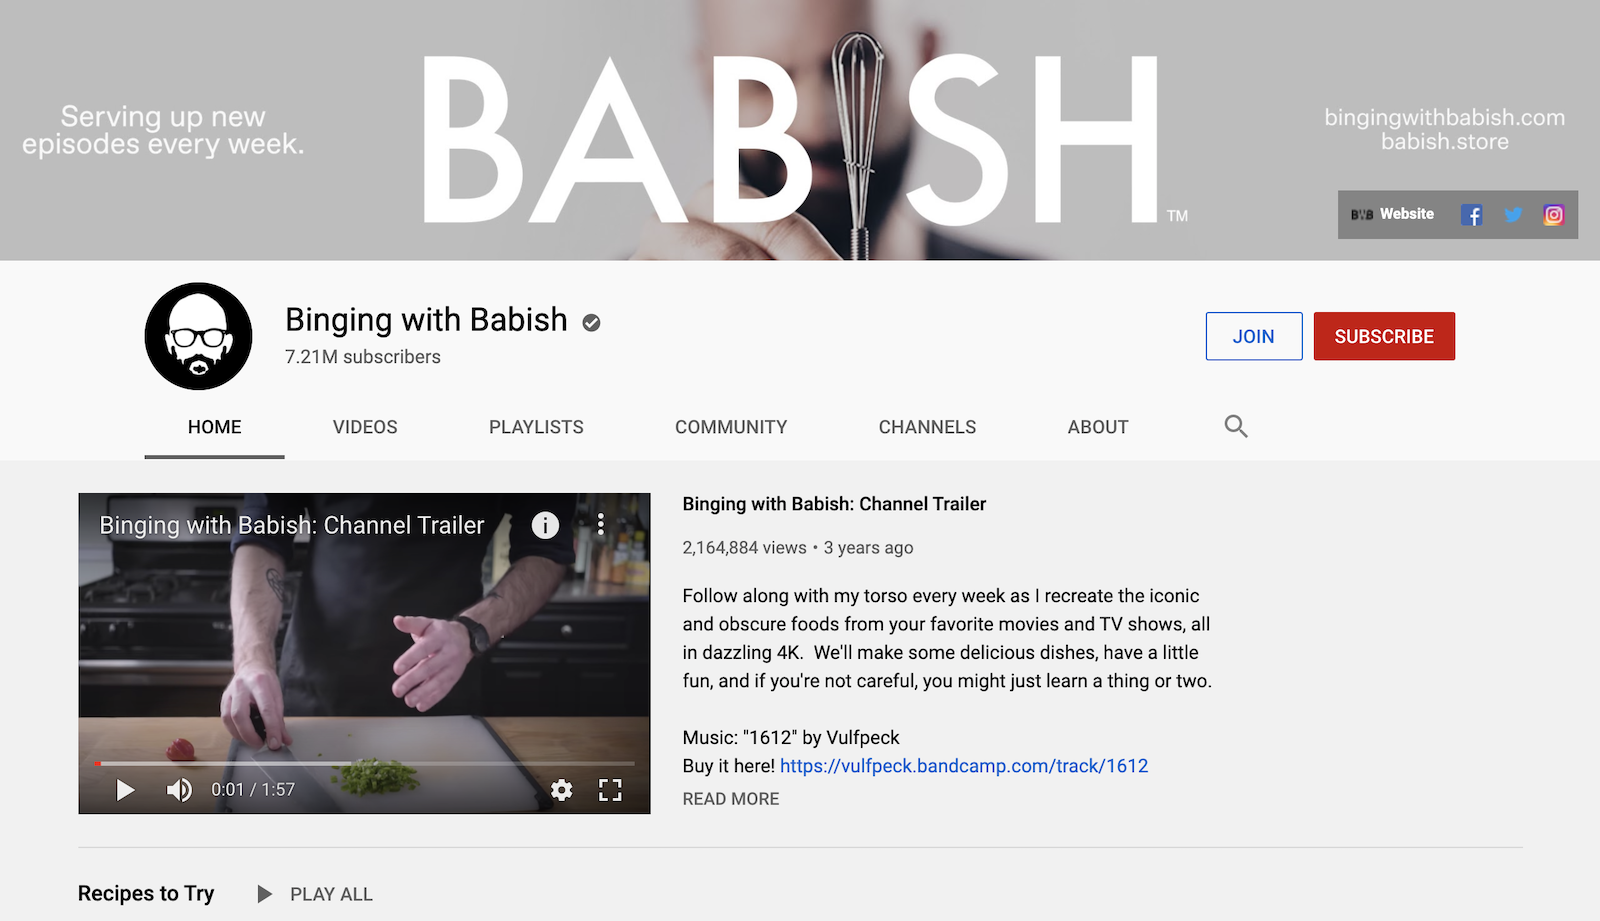
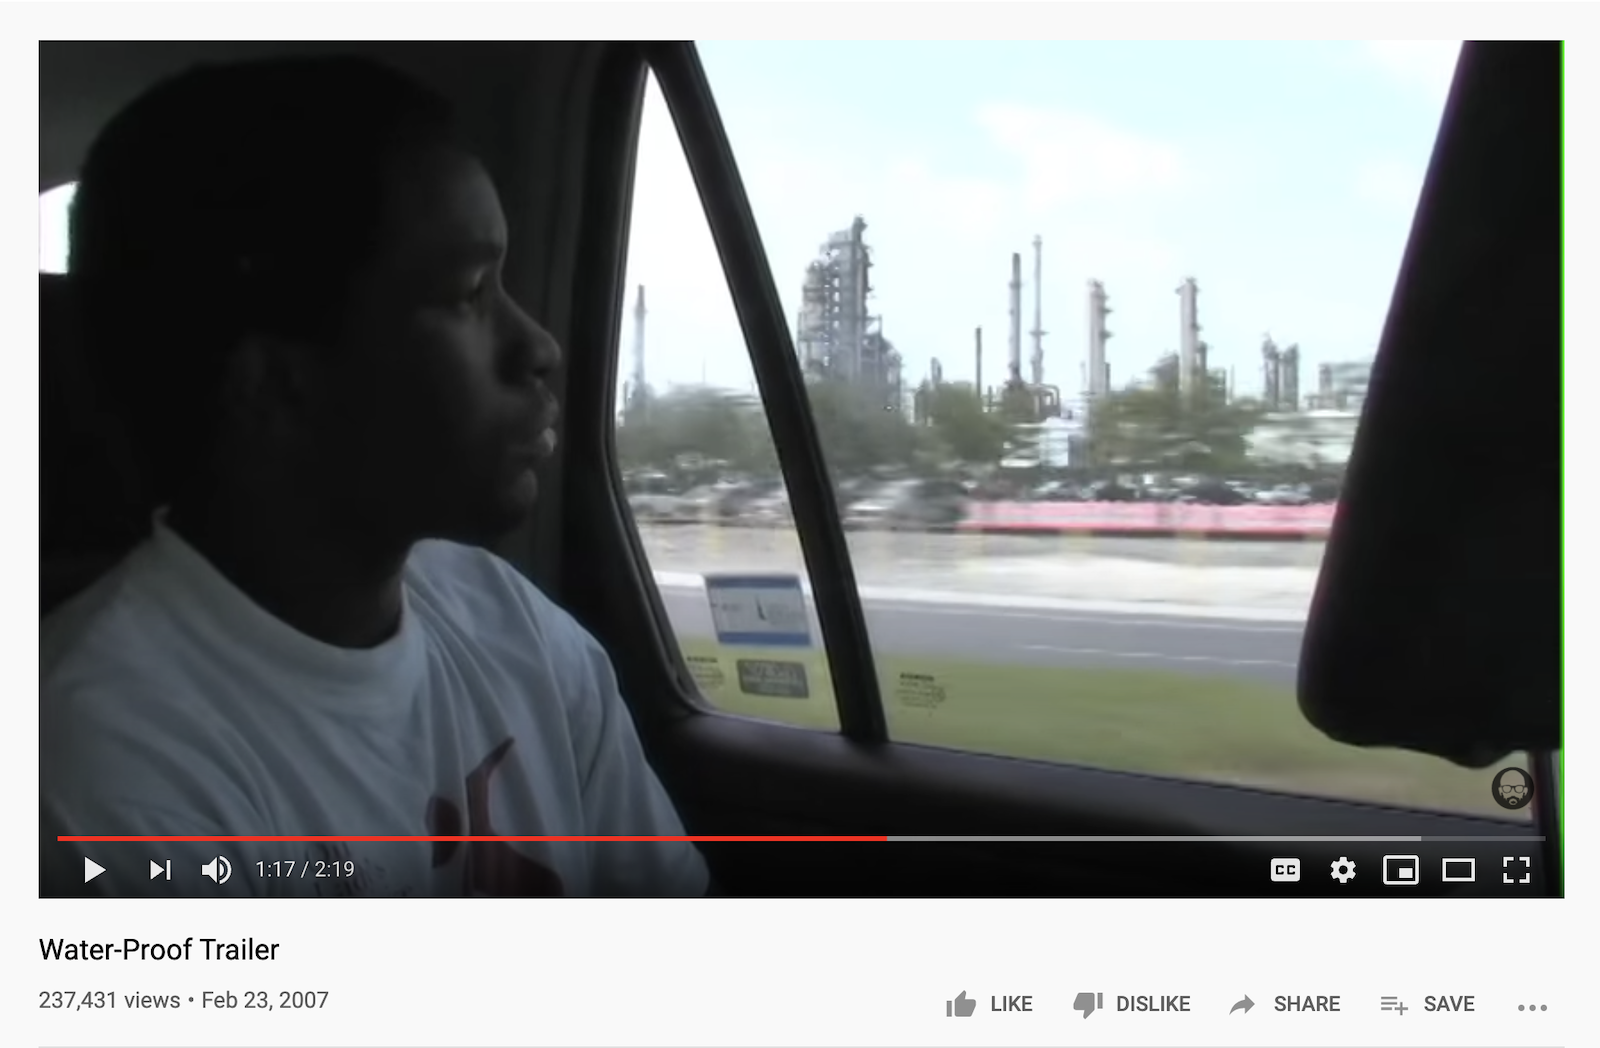
The second channel with most trending videos is Binging with Babish with 361 trending videos. This channel started in 2006 and has now 311 published videos. This is how it looks now:
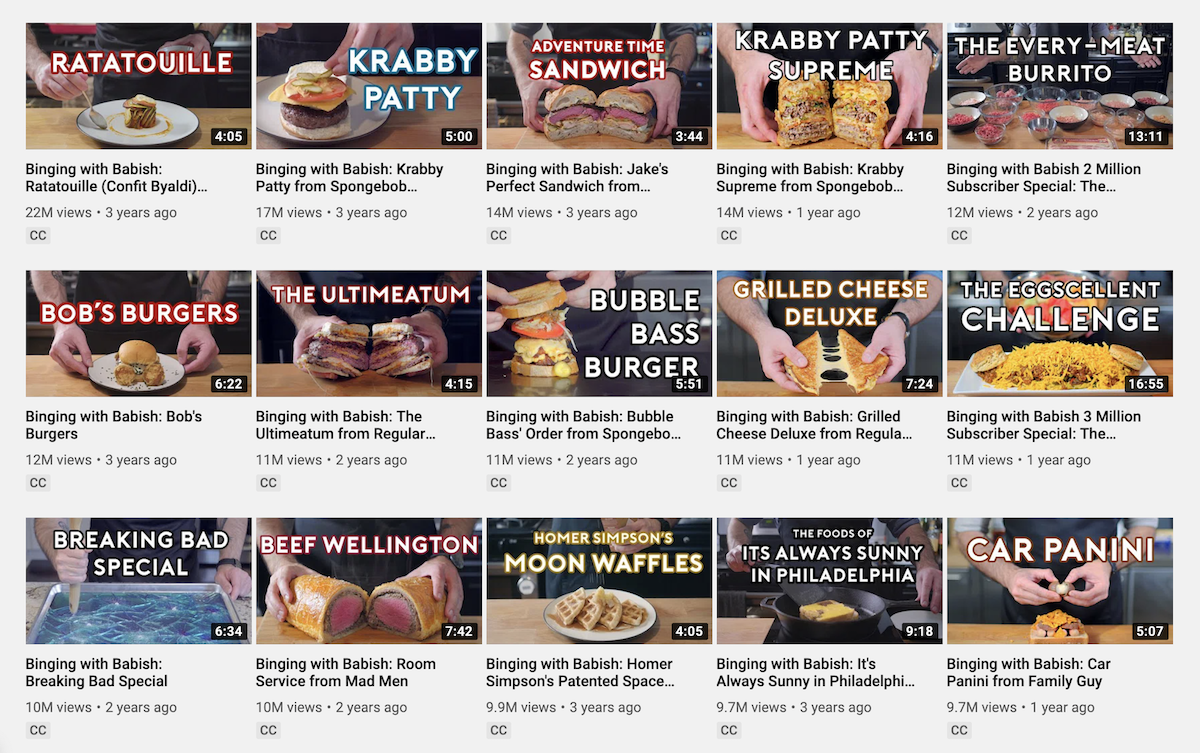
And these are their most popular videos as of now:
And this is how their first video looked like back in 2007:
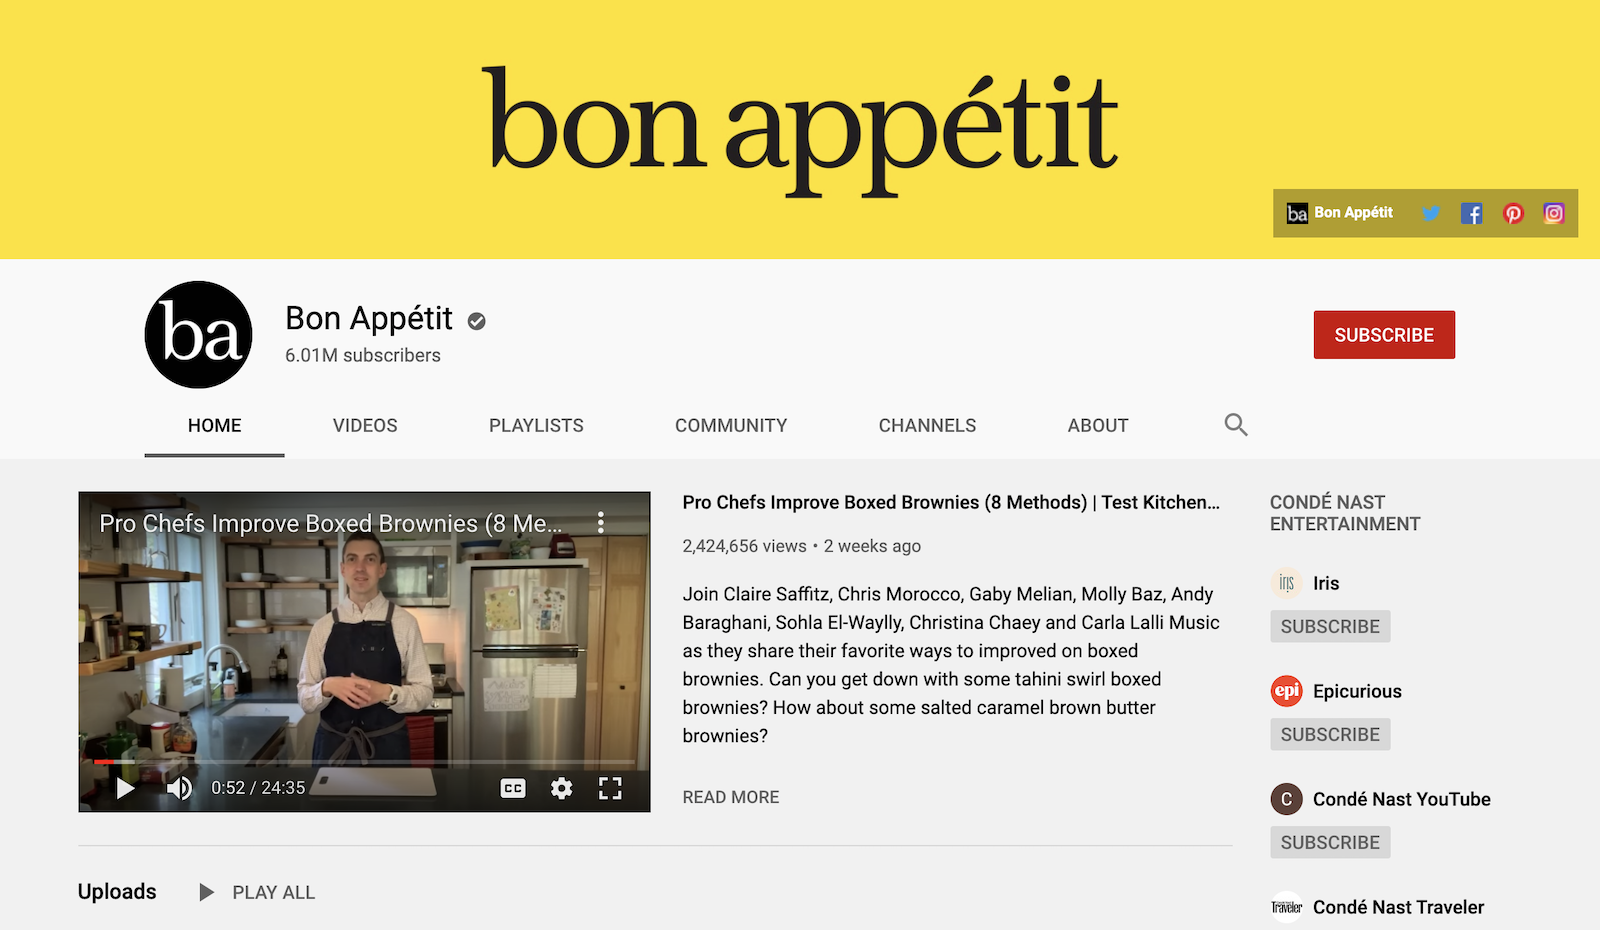
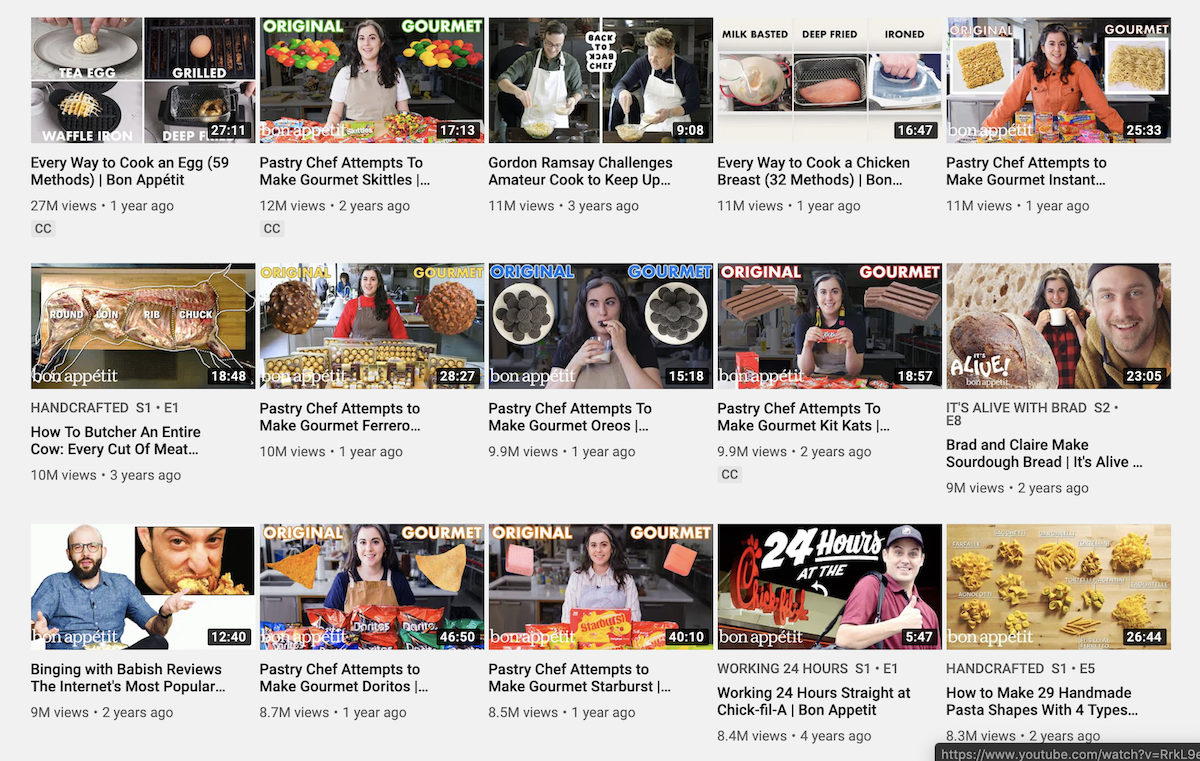
And finally, the third top channel in the number of trending videos is Bon Appétit with 355 trending videos. This channel started back in 2008 and has now 1,149 published videos. This is how the channel page looks like now:
And these are their most popular videos as of now:
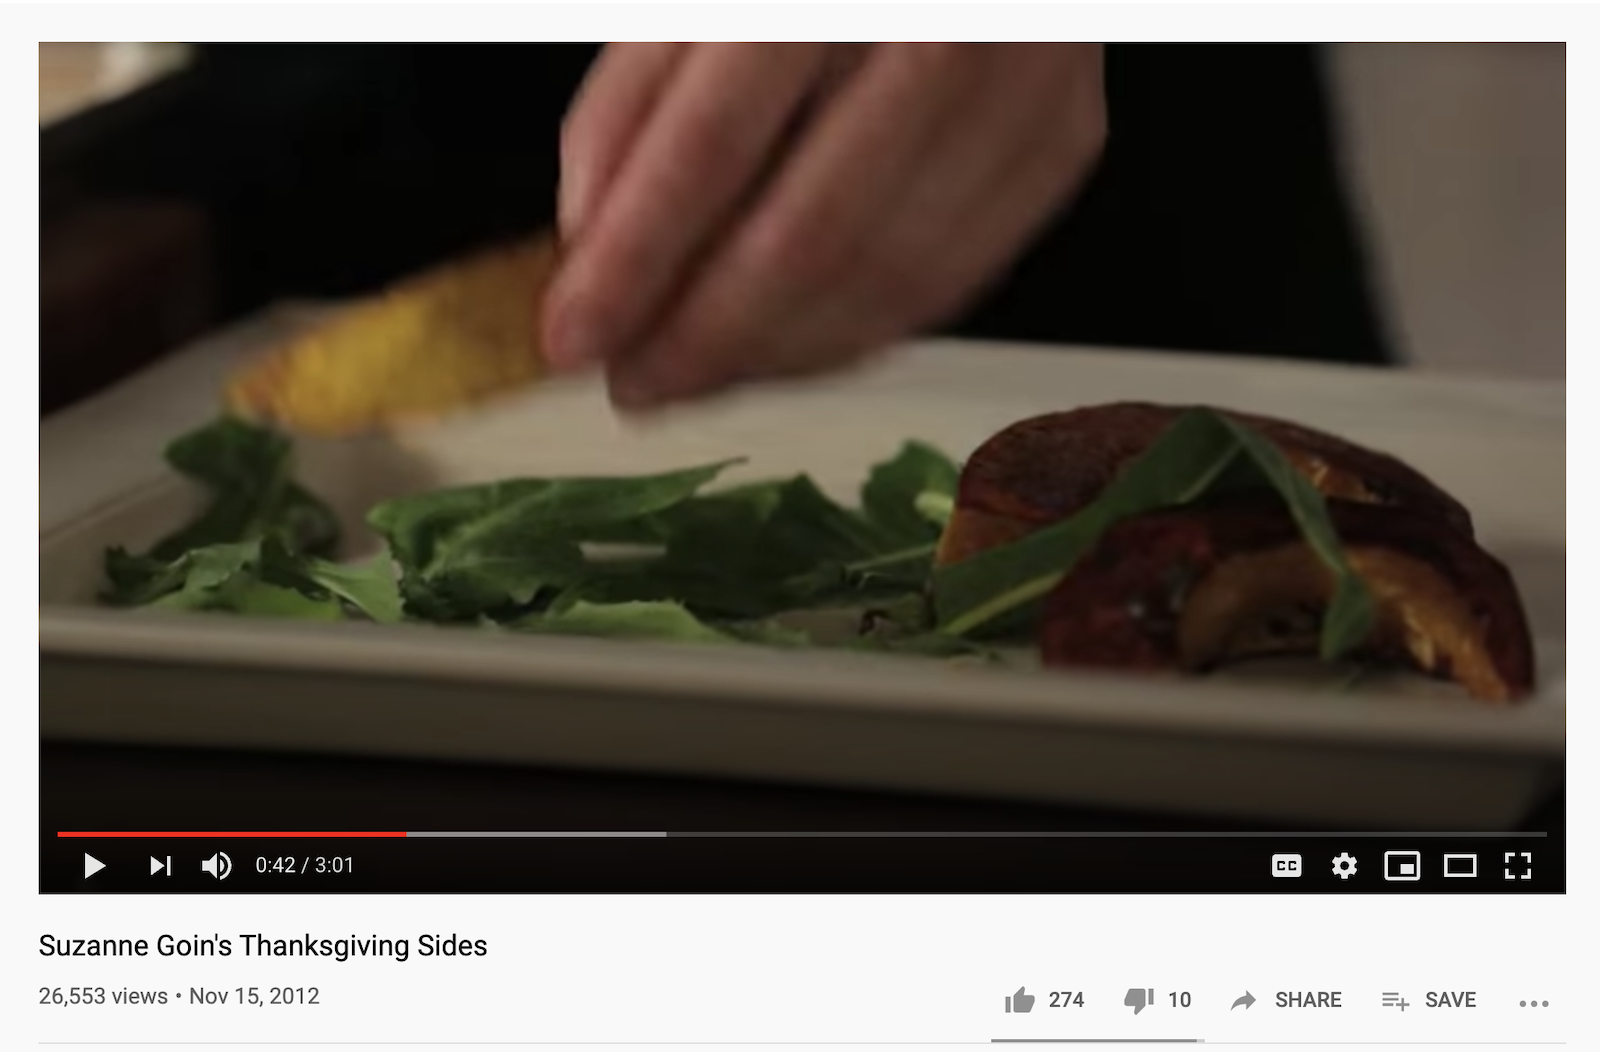
And this is their first video published in 2012:
Trending Videos Categories
YouTube groups videos into categories. Example categories are: Entertainment, Music, Sports, Comedy, Education, etc. The following bar chart shows the number of trending videos for each category. The chart doesn’t include all categories because there are some categories with no trending videos in 2019.
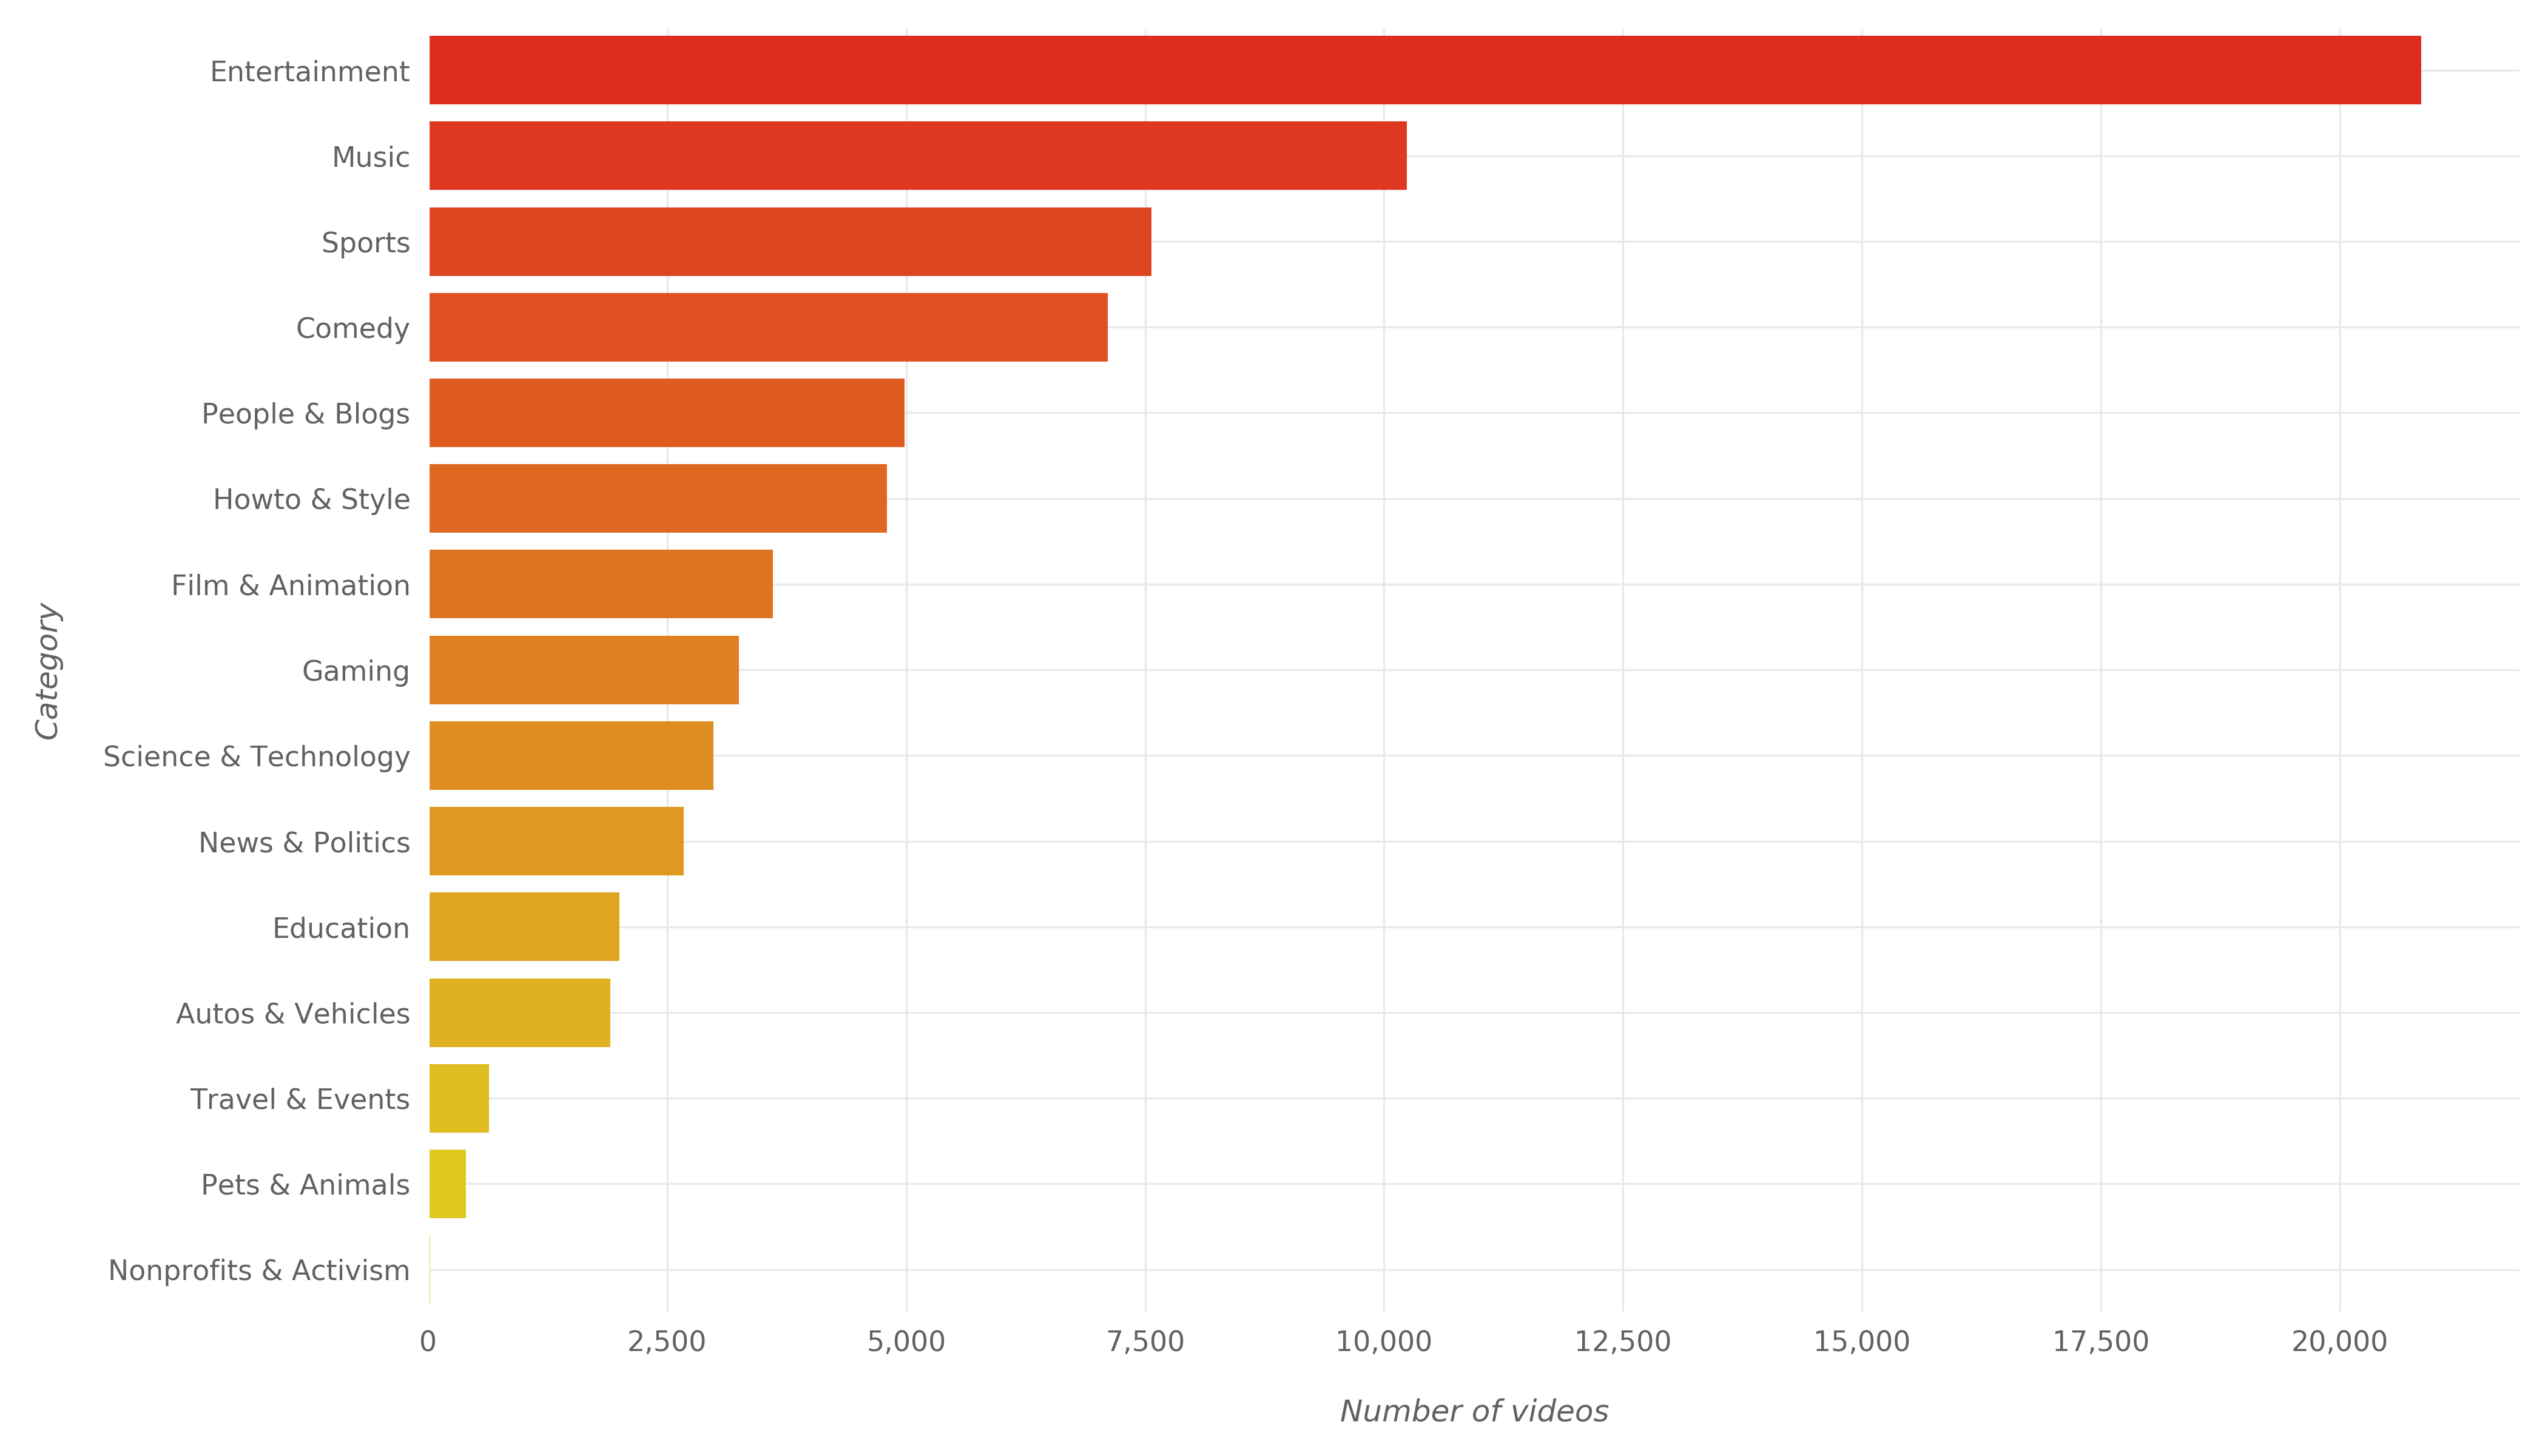
Entertainment category comes first with 20,849 trending videos (28.6% of 2019’s trending videos). After Entertainment comes Music category with 10,236 trending videos (14% of 2019’s trending videos). Then at the third place comes Sports category with 7,565 trending videos (10.4% of 2019’s trending videos).
Looking at this graph gives an idea on what types of videos appear on the trending list more than others.
When were Trending Videos Published?
Were there more trending videos published on Saturday more than on Monday? Were there more trending videos published in the evening more than the morning? Let’s answer these questions with nice visualizations.
Note: The following two graphs show dates/times in GMT time zone which is now 4 hours ahead of Washington, DC.
The following graph shows the number of trending videos published in every day of the week sorted by the number of videos:
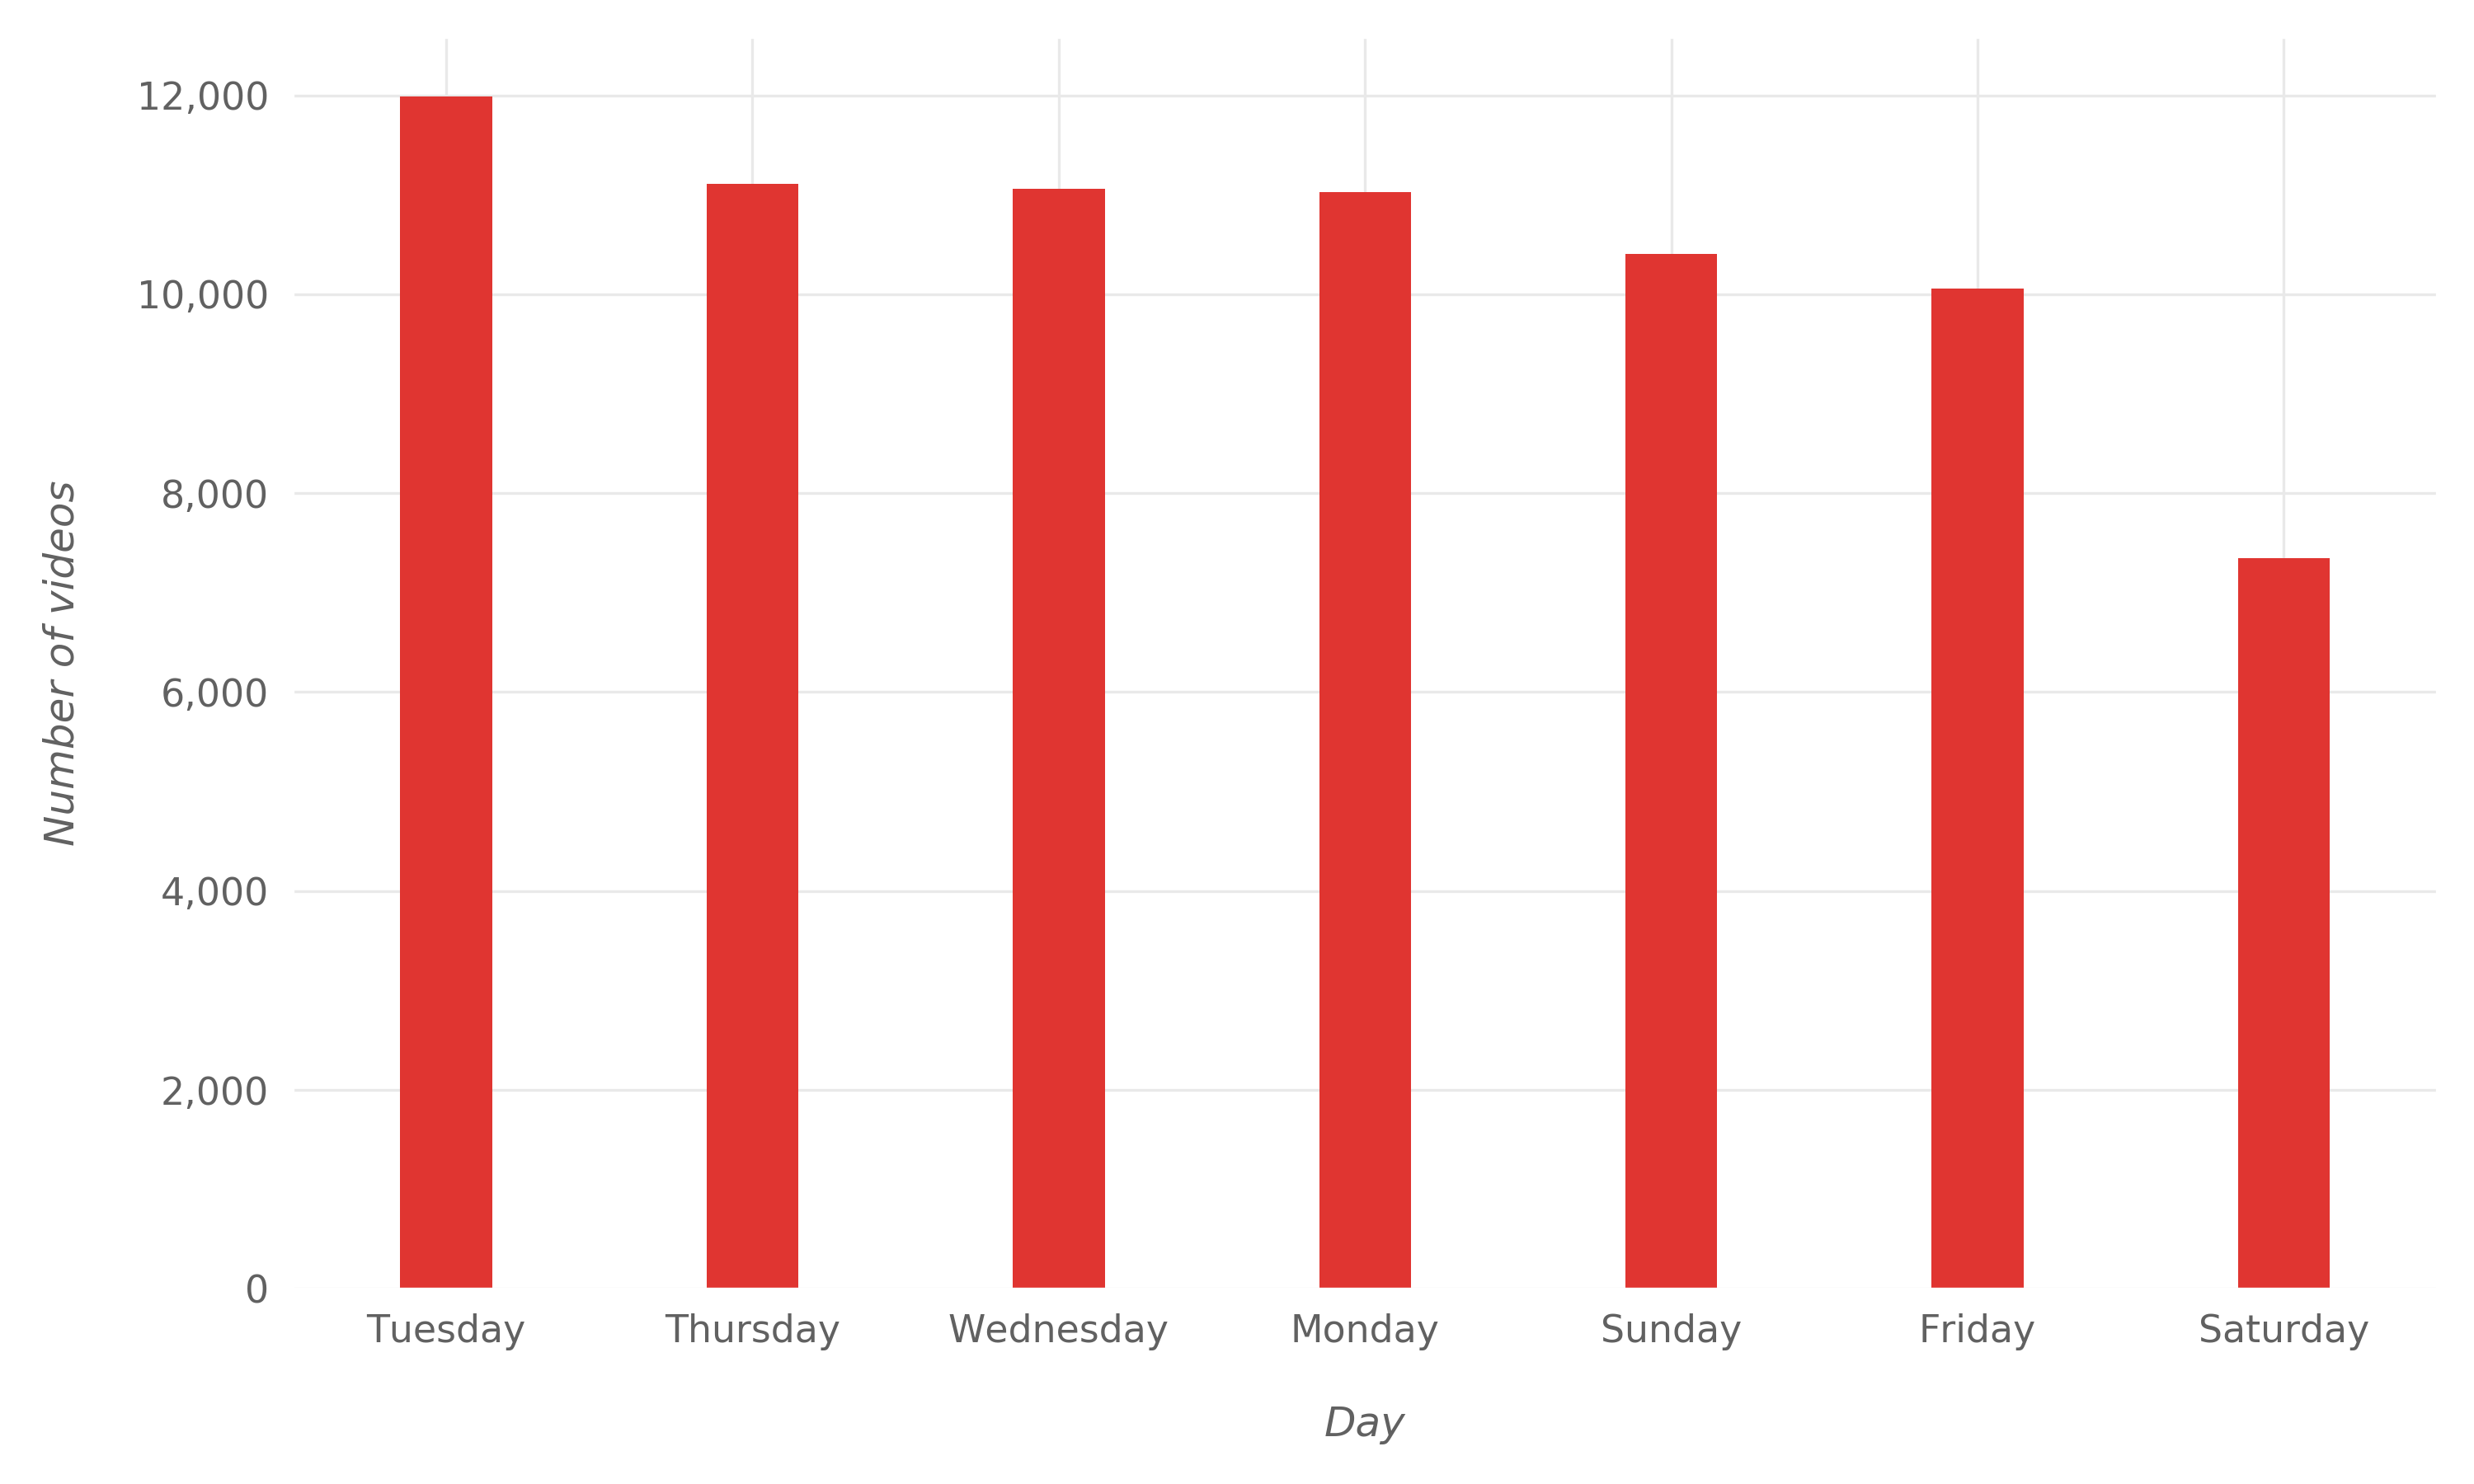
We can see that there were more trending videos published on Tuesday (11,986) than the other days of the week. All other days of the week except Saturday are not far behind Tuesday. For Saturday, there were only 7,345 trending videos published on it.
The following graph shows the number of trending videos published in every hour of the day starting with 0 which represents 12 AM and ending with 23 which represents 11 PM:
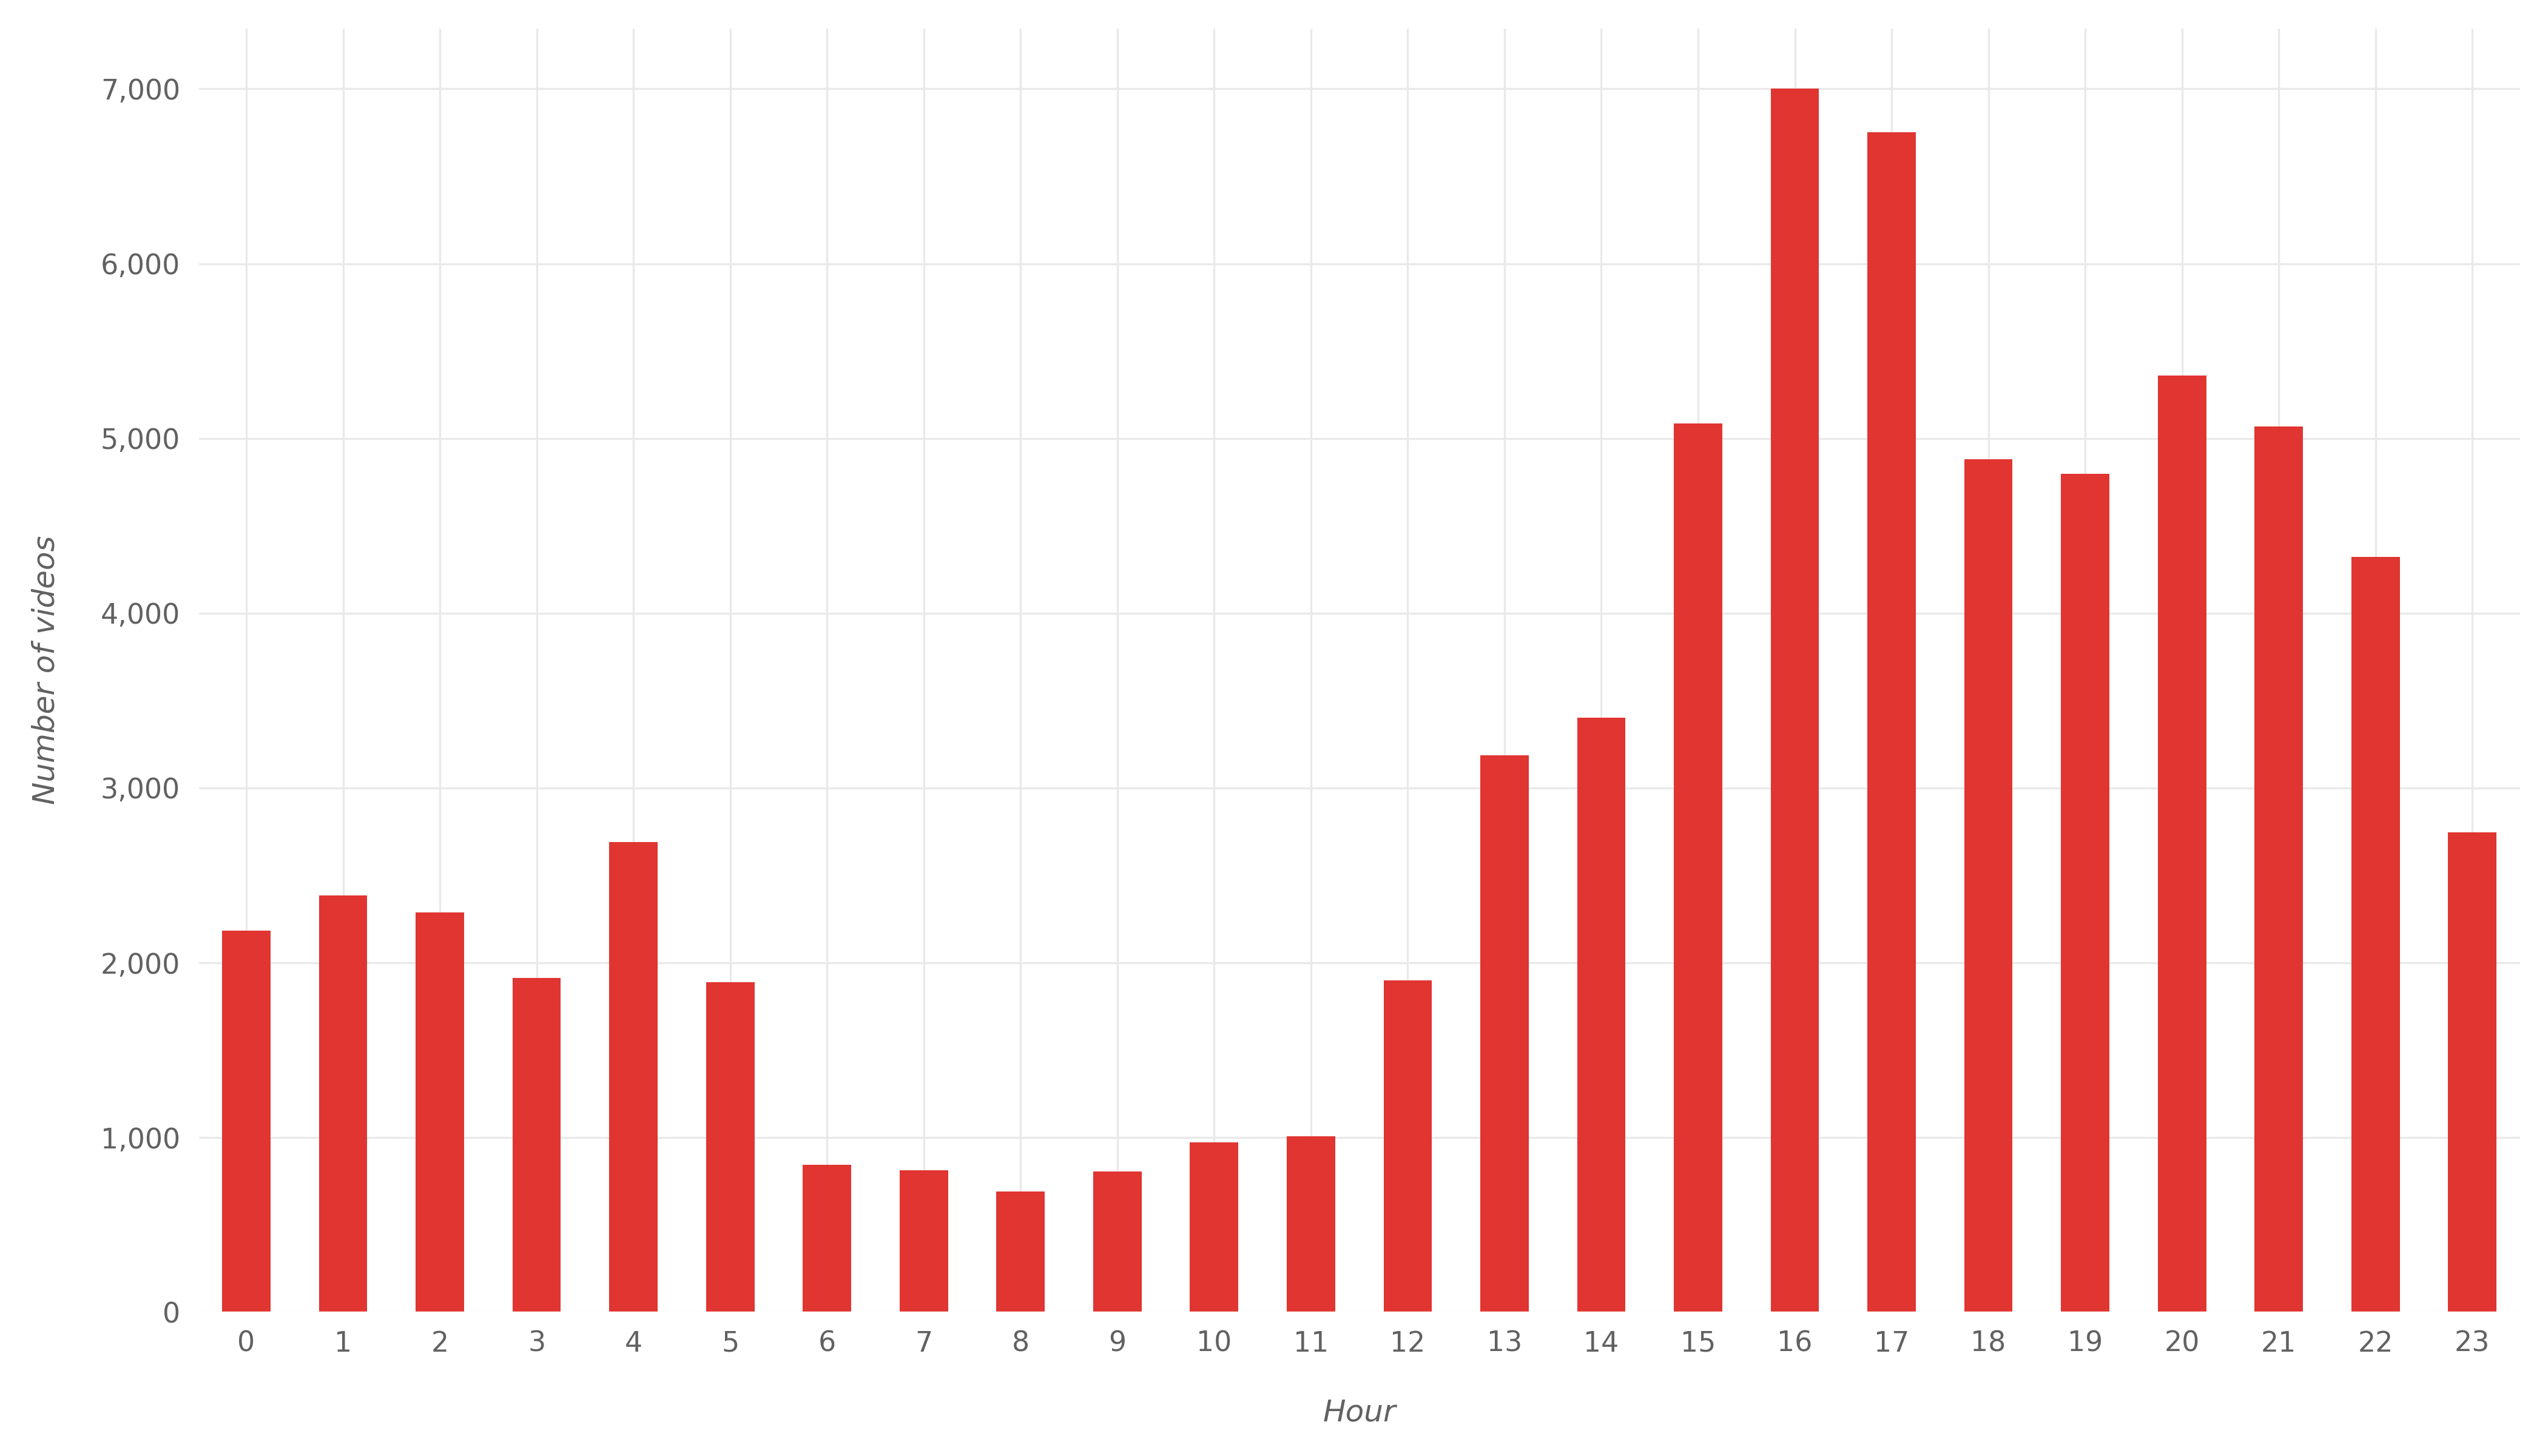
We can see that the peak hours for publishing trending videos were between 16 and 18 (i.e. between 4 PM and 6 PM). If we translate this to Washington time (with daylight saving time in effect), we see that the peak hours were between 12 PM and 2 PM Washington time.
We can also see that much fewer trending videos were published between 6 and 11 (i.e. between 6 AM and 11 AM) which is between 2 AM and 7 AM in Washington time (with daylight saving time in effect).
The two graphs above don’t necessarily mean that videos published on Tuesday have higher chances of becoming trending because Tuesday might be the day that witnessed more uploaded videos in general than other days. So we need to know the number of all videos (not just trending videos) that were published on each day of the week in 2019 to be able to make such claims. The same applies for hours of the day as well.
Trending Videos and Comments
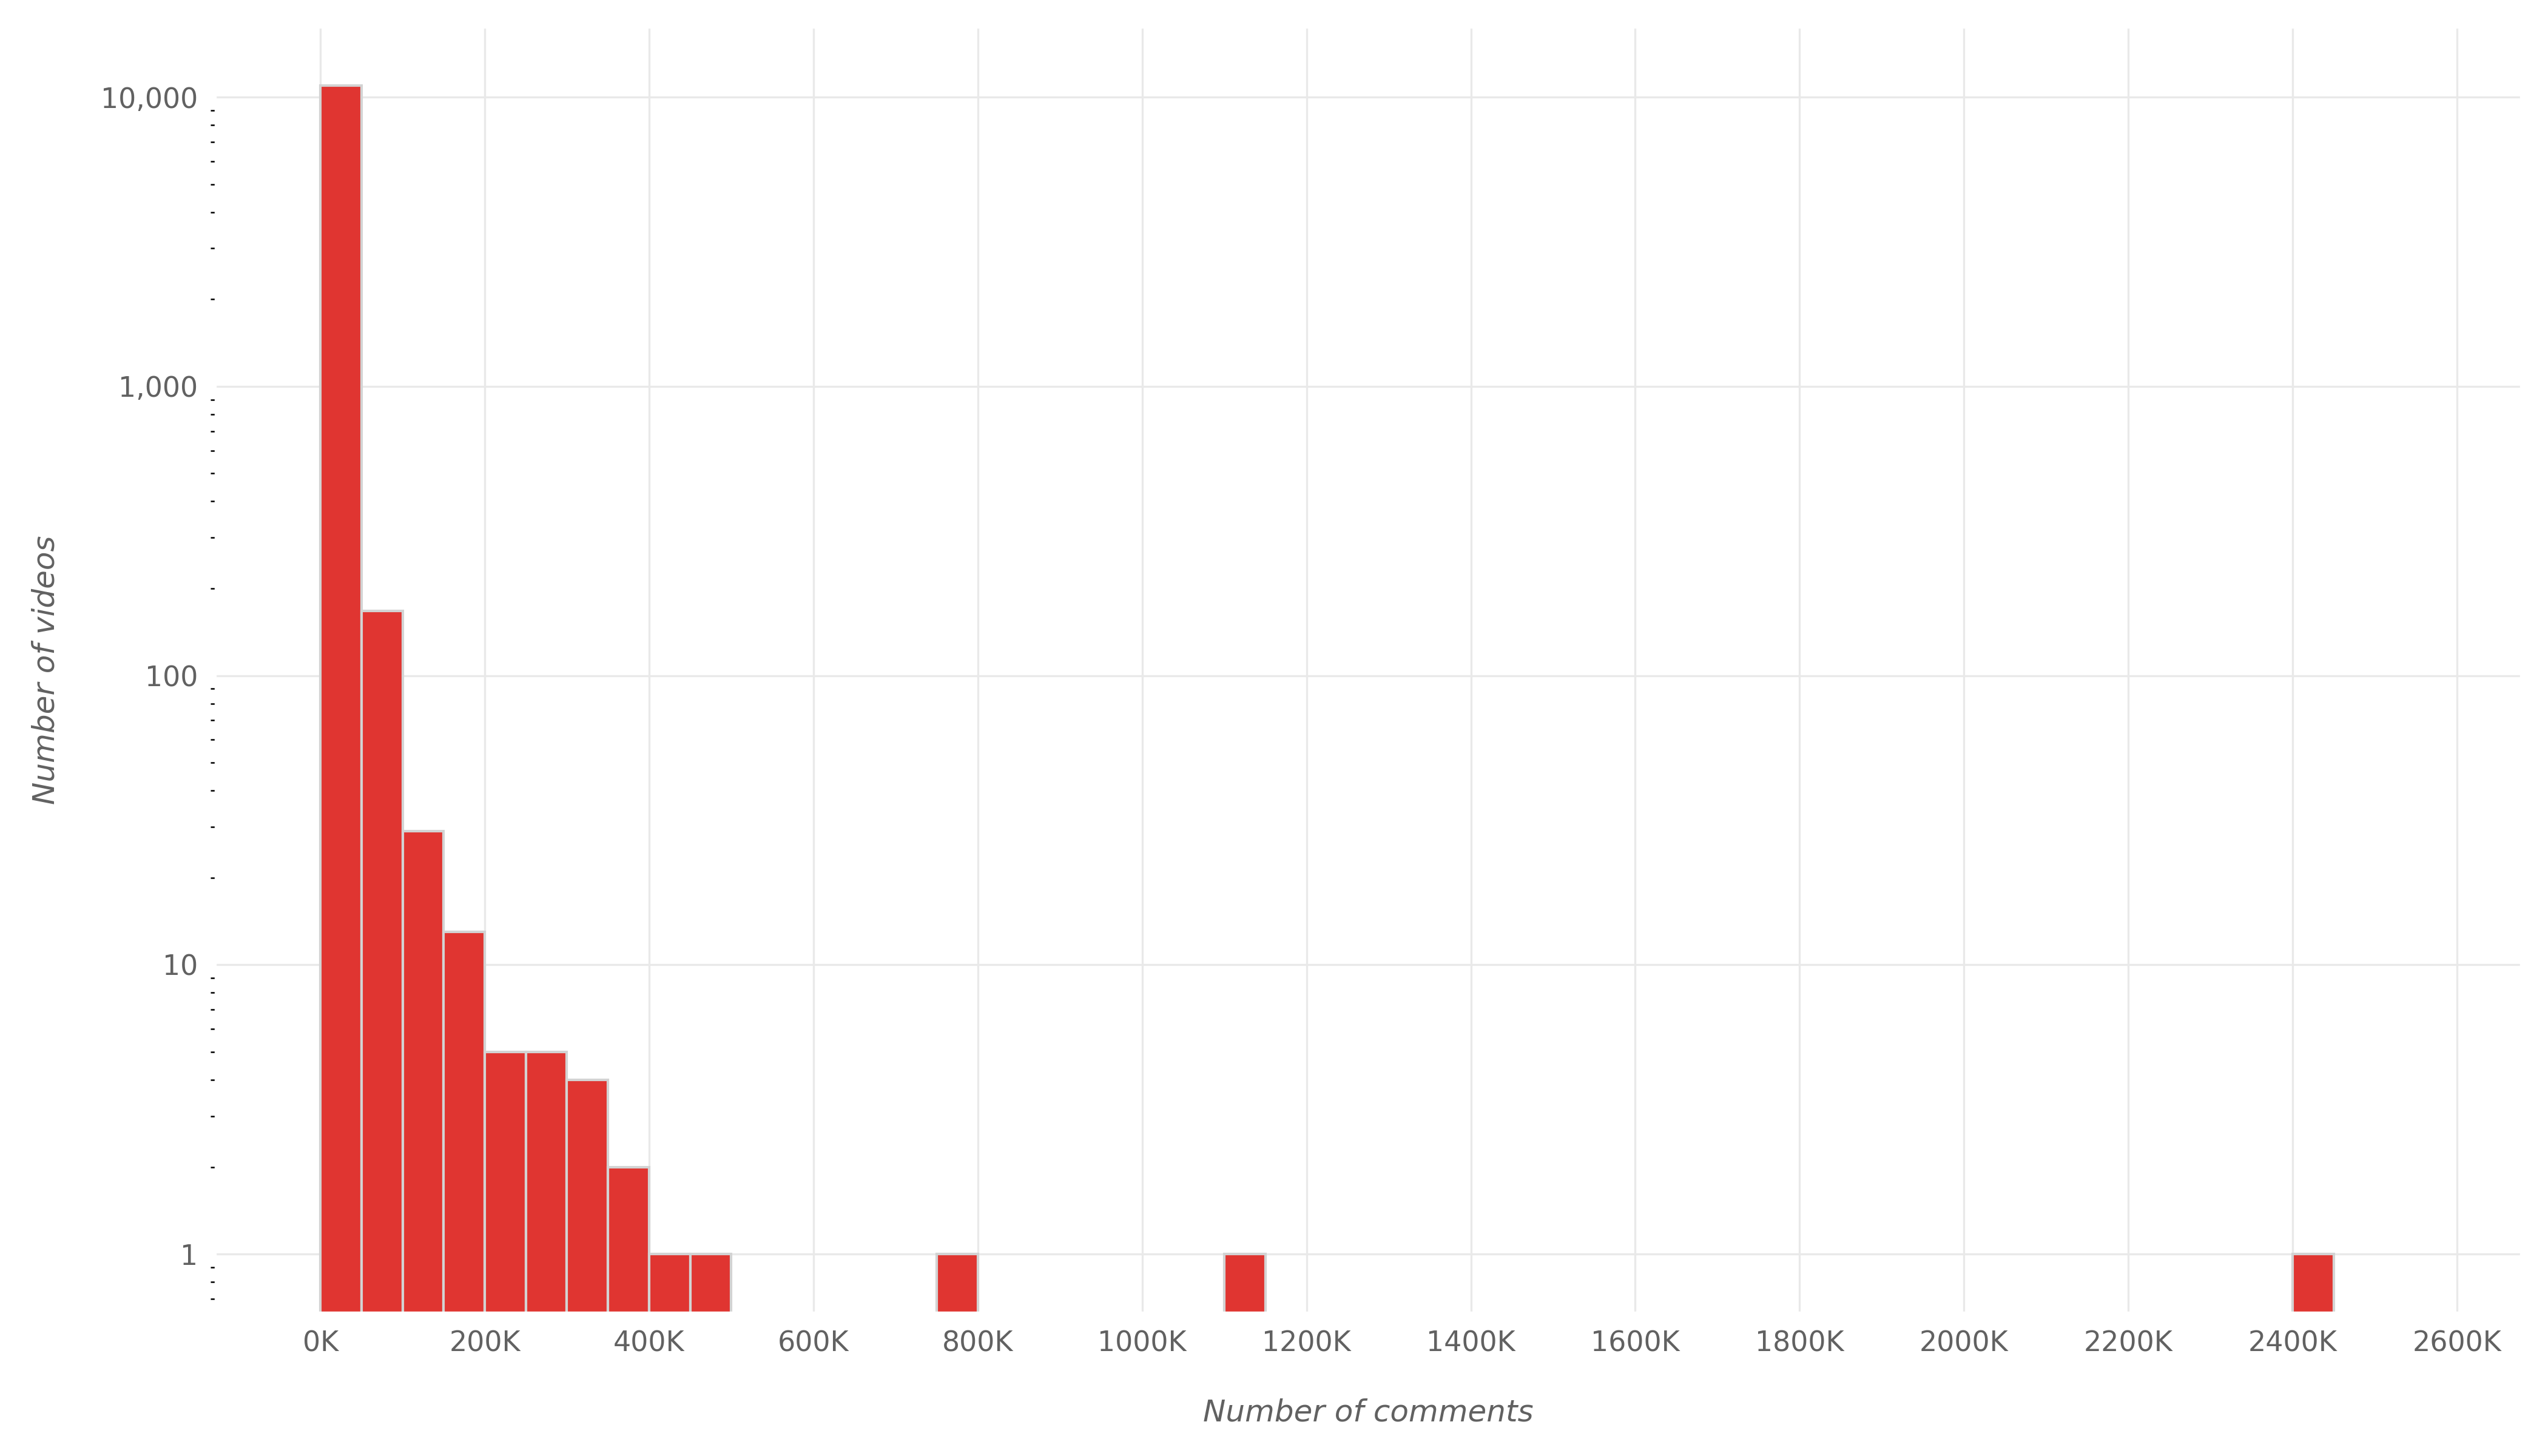
How many comments trending videos have? The histogram below answers this question by showing the distribution of the number of comments for our trending videos:
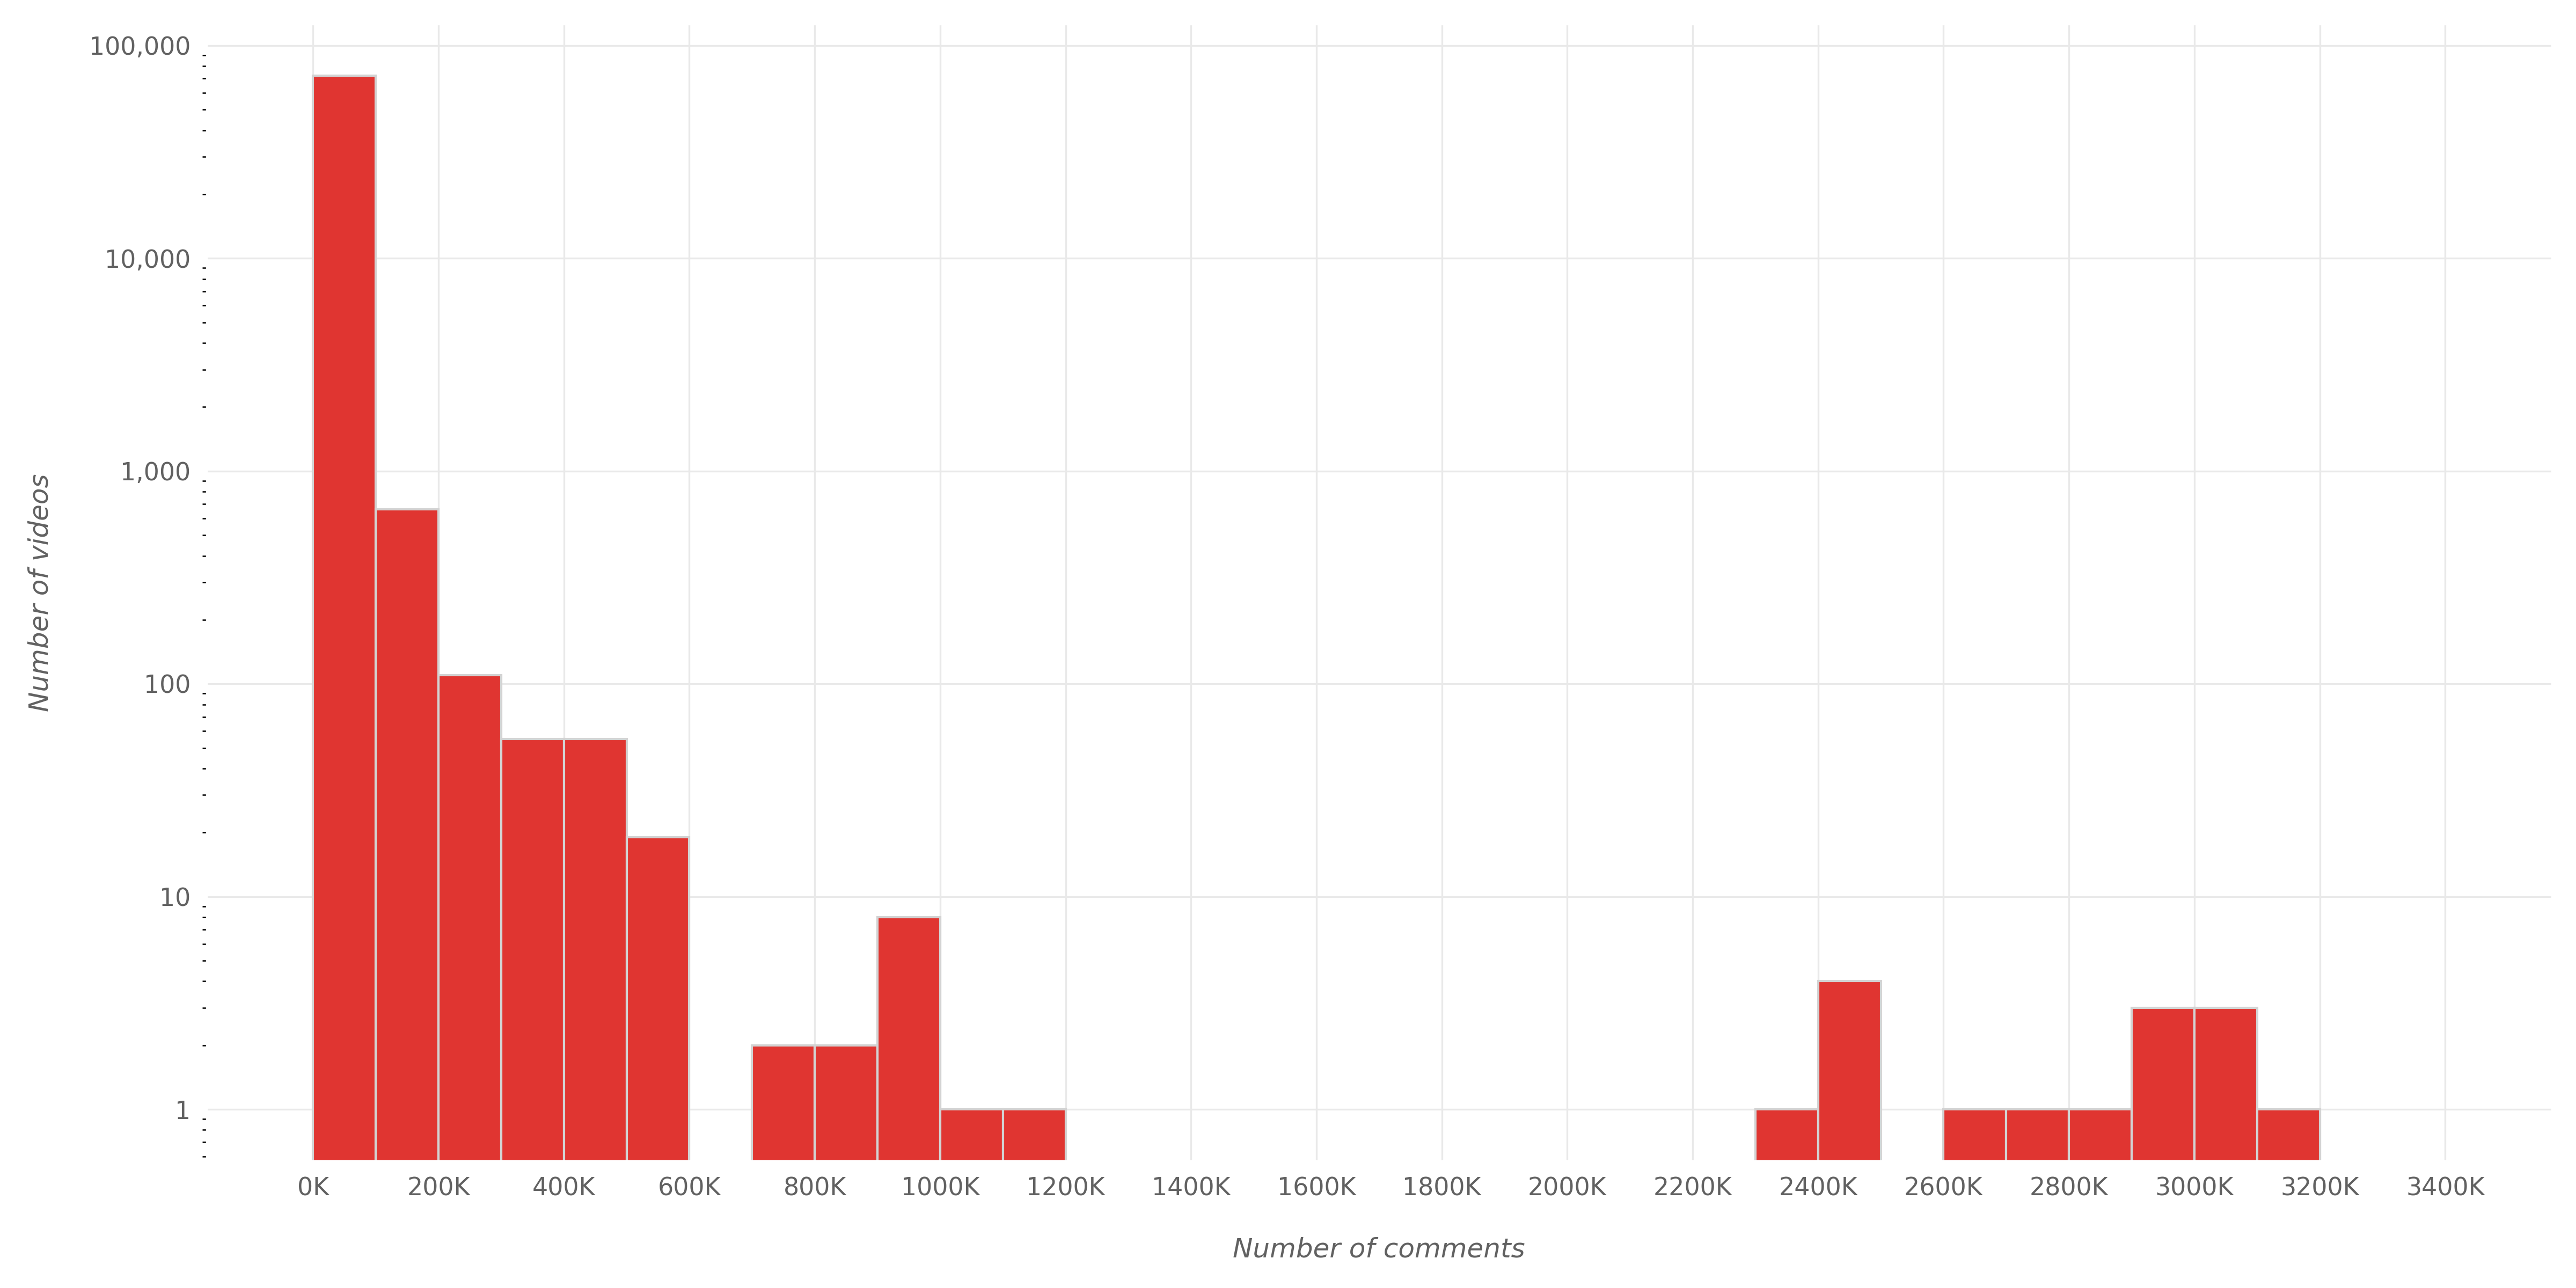
Notice that the y-axis is log scaled. It is 10, 100, 1000… not 10, 20, 30…
We can see that the vast majority of trending videos have less than 100,000 comments. More precisely, 98.7% of trending videos have less than 100,000 comments and 90% of trending videos have less than 23,926 comments.
We can notice that there are some videos with huge numbers of comments: we see one video with ~3,100,000 comments; we also see other few videos with numbers of comments ranging between 600,000 and 3,100,000.
The table below shows the top 3 trending videos based on the number of comments:
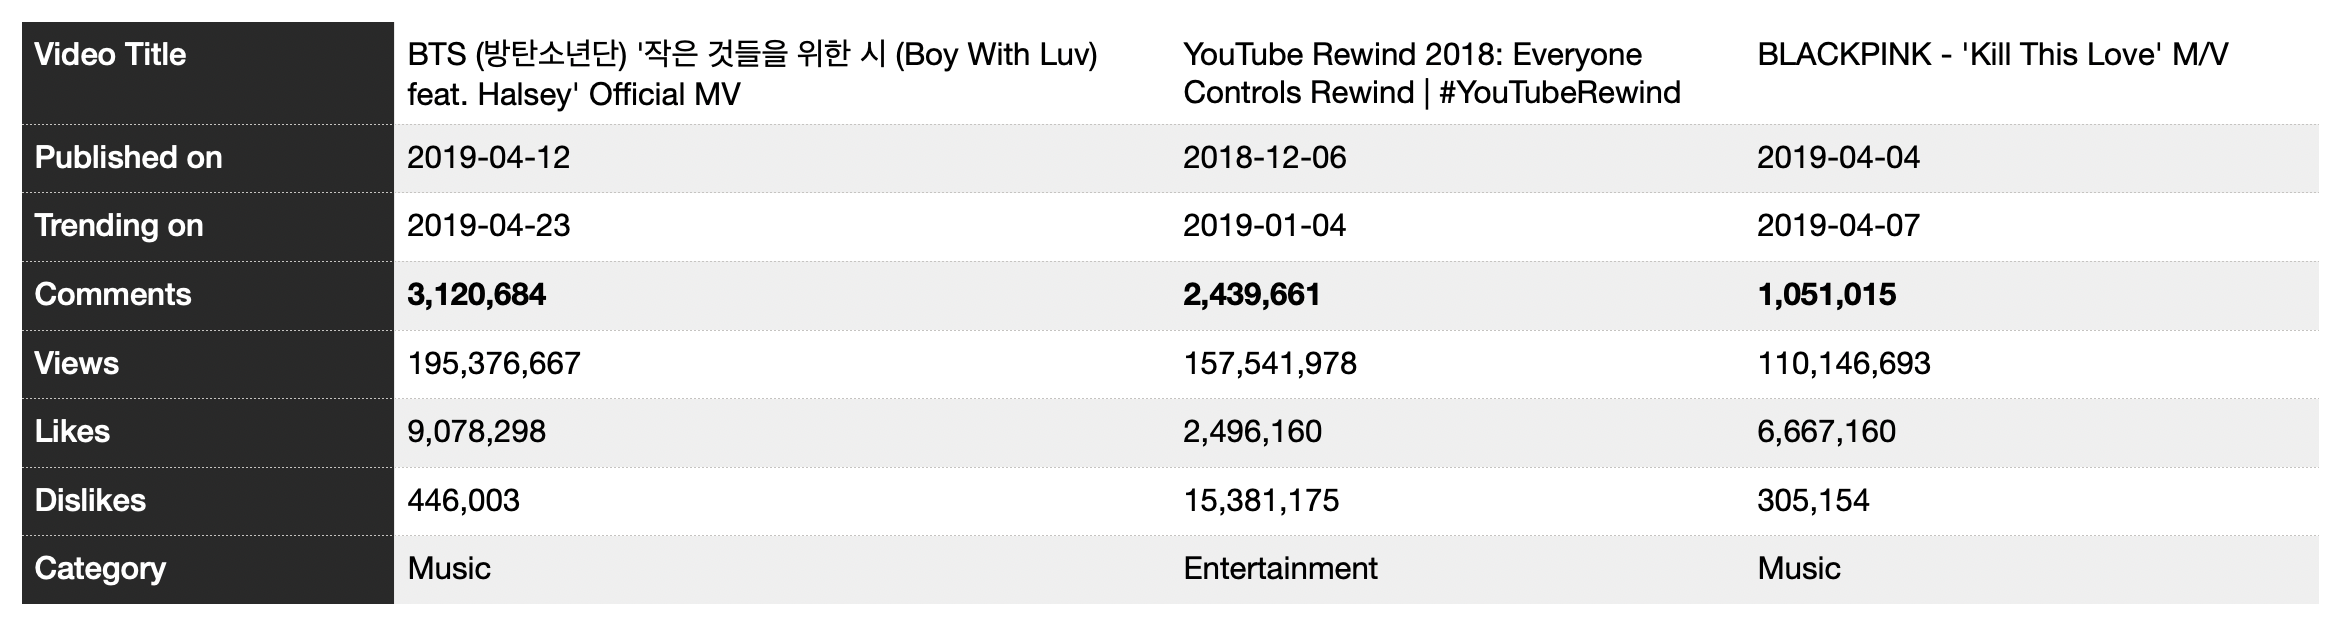
We can see that “Boy With Luv” song by BTS band had the largest number of comments (3,120,684). We saw previously that this song had the largest number of views as well. After this song comes YouTube Rewind 2018 video with 2,439,661 comments then “Kill This Love” song by BLACKPINK band with 1,051,015 comments.
How Many Comments Videos Had When they First Became Trending?
Like we did with the number of views, we will see the number of comments videos have when whey appear on the trending list for the first time. The following graph shows us that:
Notice that the y-axis is log scaled. It is 10, 100, 1000… not 10, 20, 30…
We can see that the vast majority of videos had less than 50,000 comments when they first appeared on the trending list. In fact:
- 90% of trending videos became trending for the first time when they had less than 14,485 comments.
- The minimum number of comments a video had when it first became trending was 7 comments only.
- The average number of comments a video had when it first became trending was 7,718 comments. The median (the 50th percentile value) was 3,056 comments.
Trending Videos and Likes.. and Dislikes
Similar to what we did with views and comments, we want to see the distribution of the number of likes/dislikes for trending videos. The histogram below shows the likes distribution:

Notice that the y-axis is log scaled. It is 10, 100, 1000… not 10, 20, 30…
95% of trending videos have less than 500,000 likes and 72.4% have less than 100,000 likes.
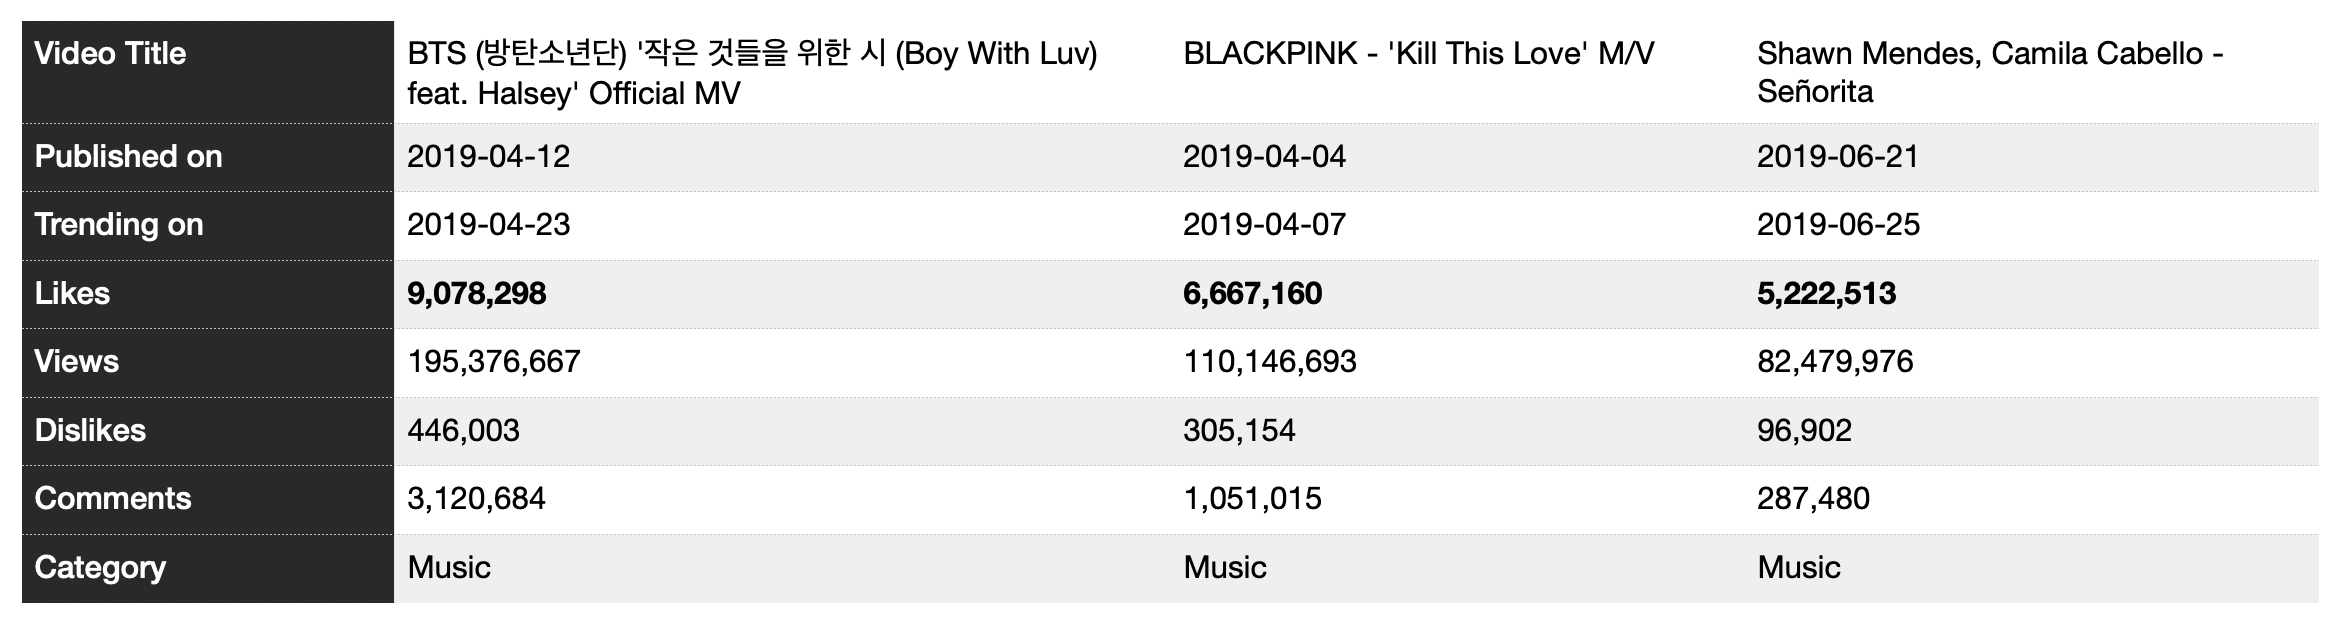
The table below shows the 3 most liked trending videos in 2019:
Then we move to dislikes. This histogram shows the distribution of dislikes of our trending videos:
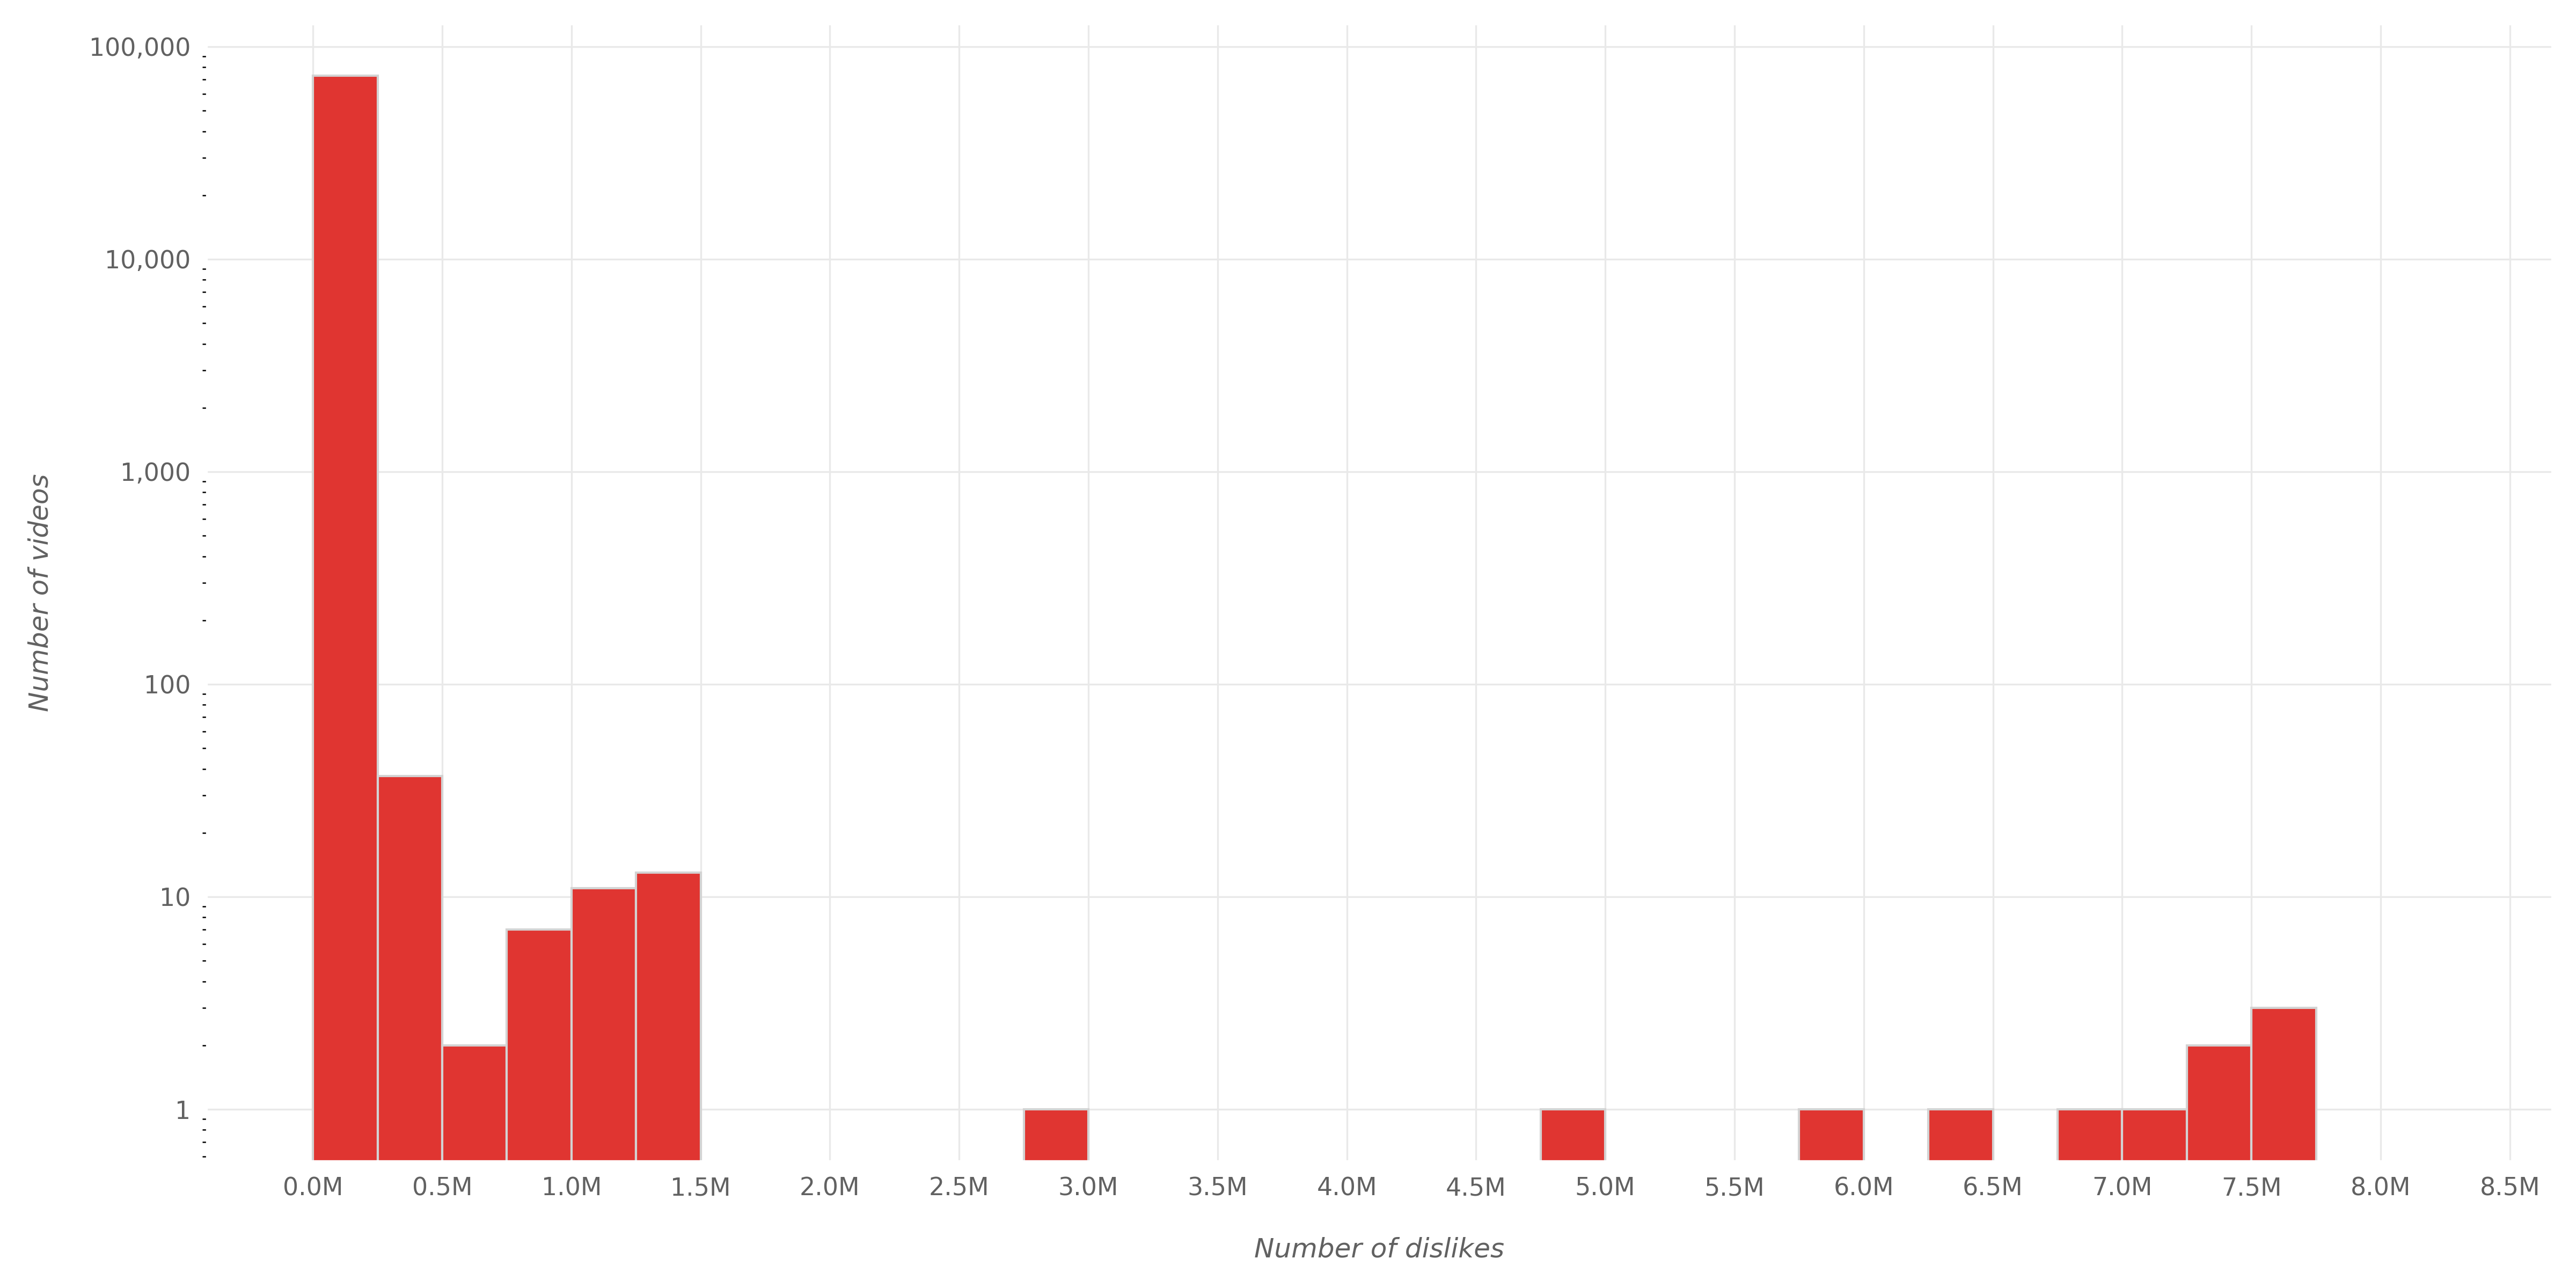
Notice that the y-axis is log scaled. It is 10, 100, 1000… not 10, 20, 30…
99.4% of trending videos have less than 100,000 dislikes and 91.5% have less than 10,000 dislikes.
The following table shows the 3 most disliked trending videos:
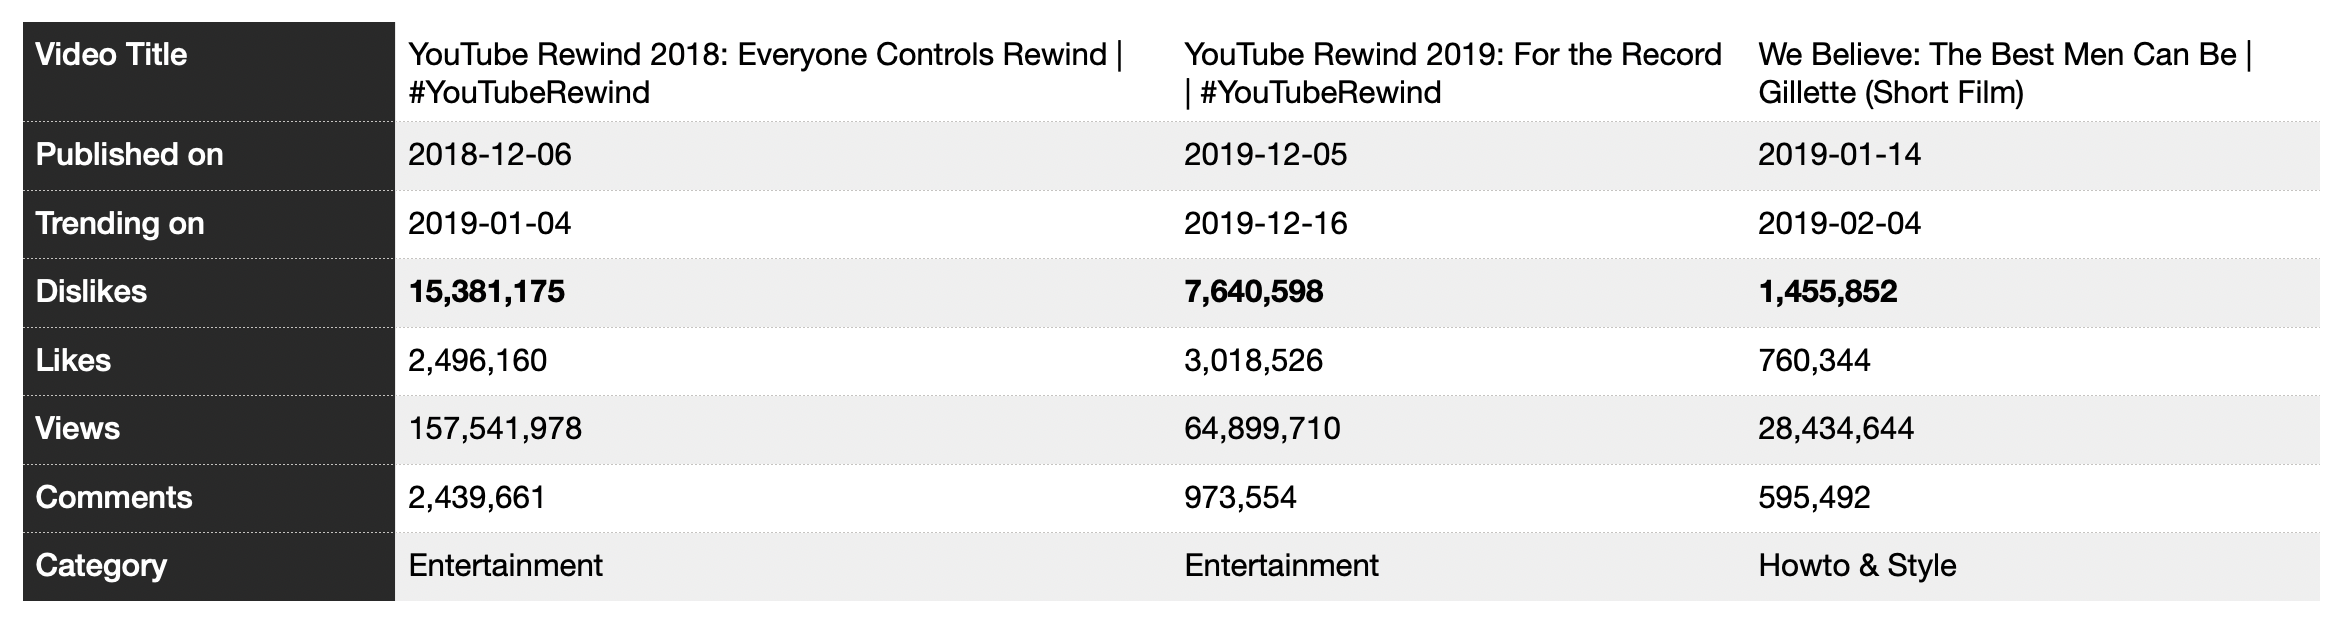
We can see that YouTube Rewind videos of 2018 and 2019 are the two most disliked trending videos in 2019. Note that the number of dislikes for the three videos in the table is larger than the number of likes but they became trending despite that.
And although “Boy With Luv” song was the most liked trending video as we saw above, it is also the 5th most disliked video with 446,003 dislikes.
How Long Does it Take a Video to Become Trending?
In other words, how many days are between publishing a video and its appearance on the trending list? The box plot below can answer this question:
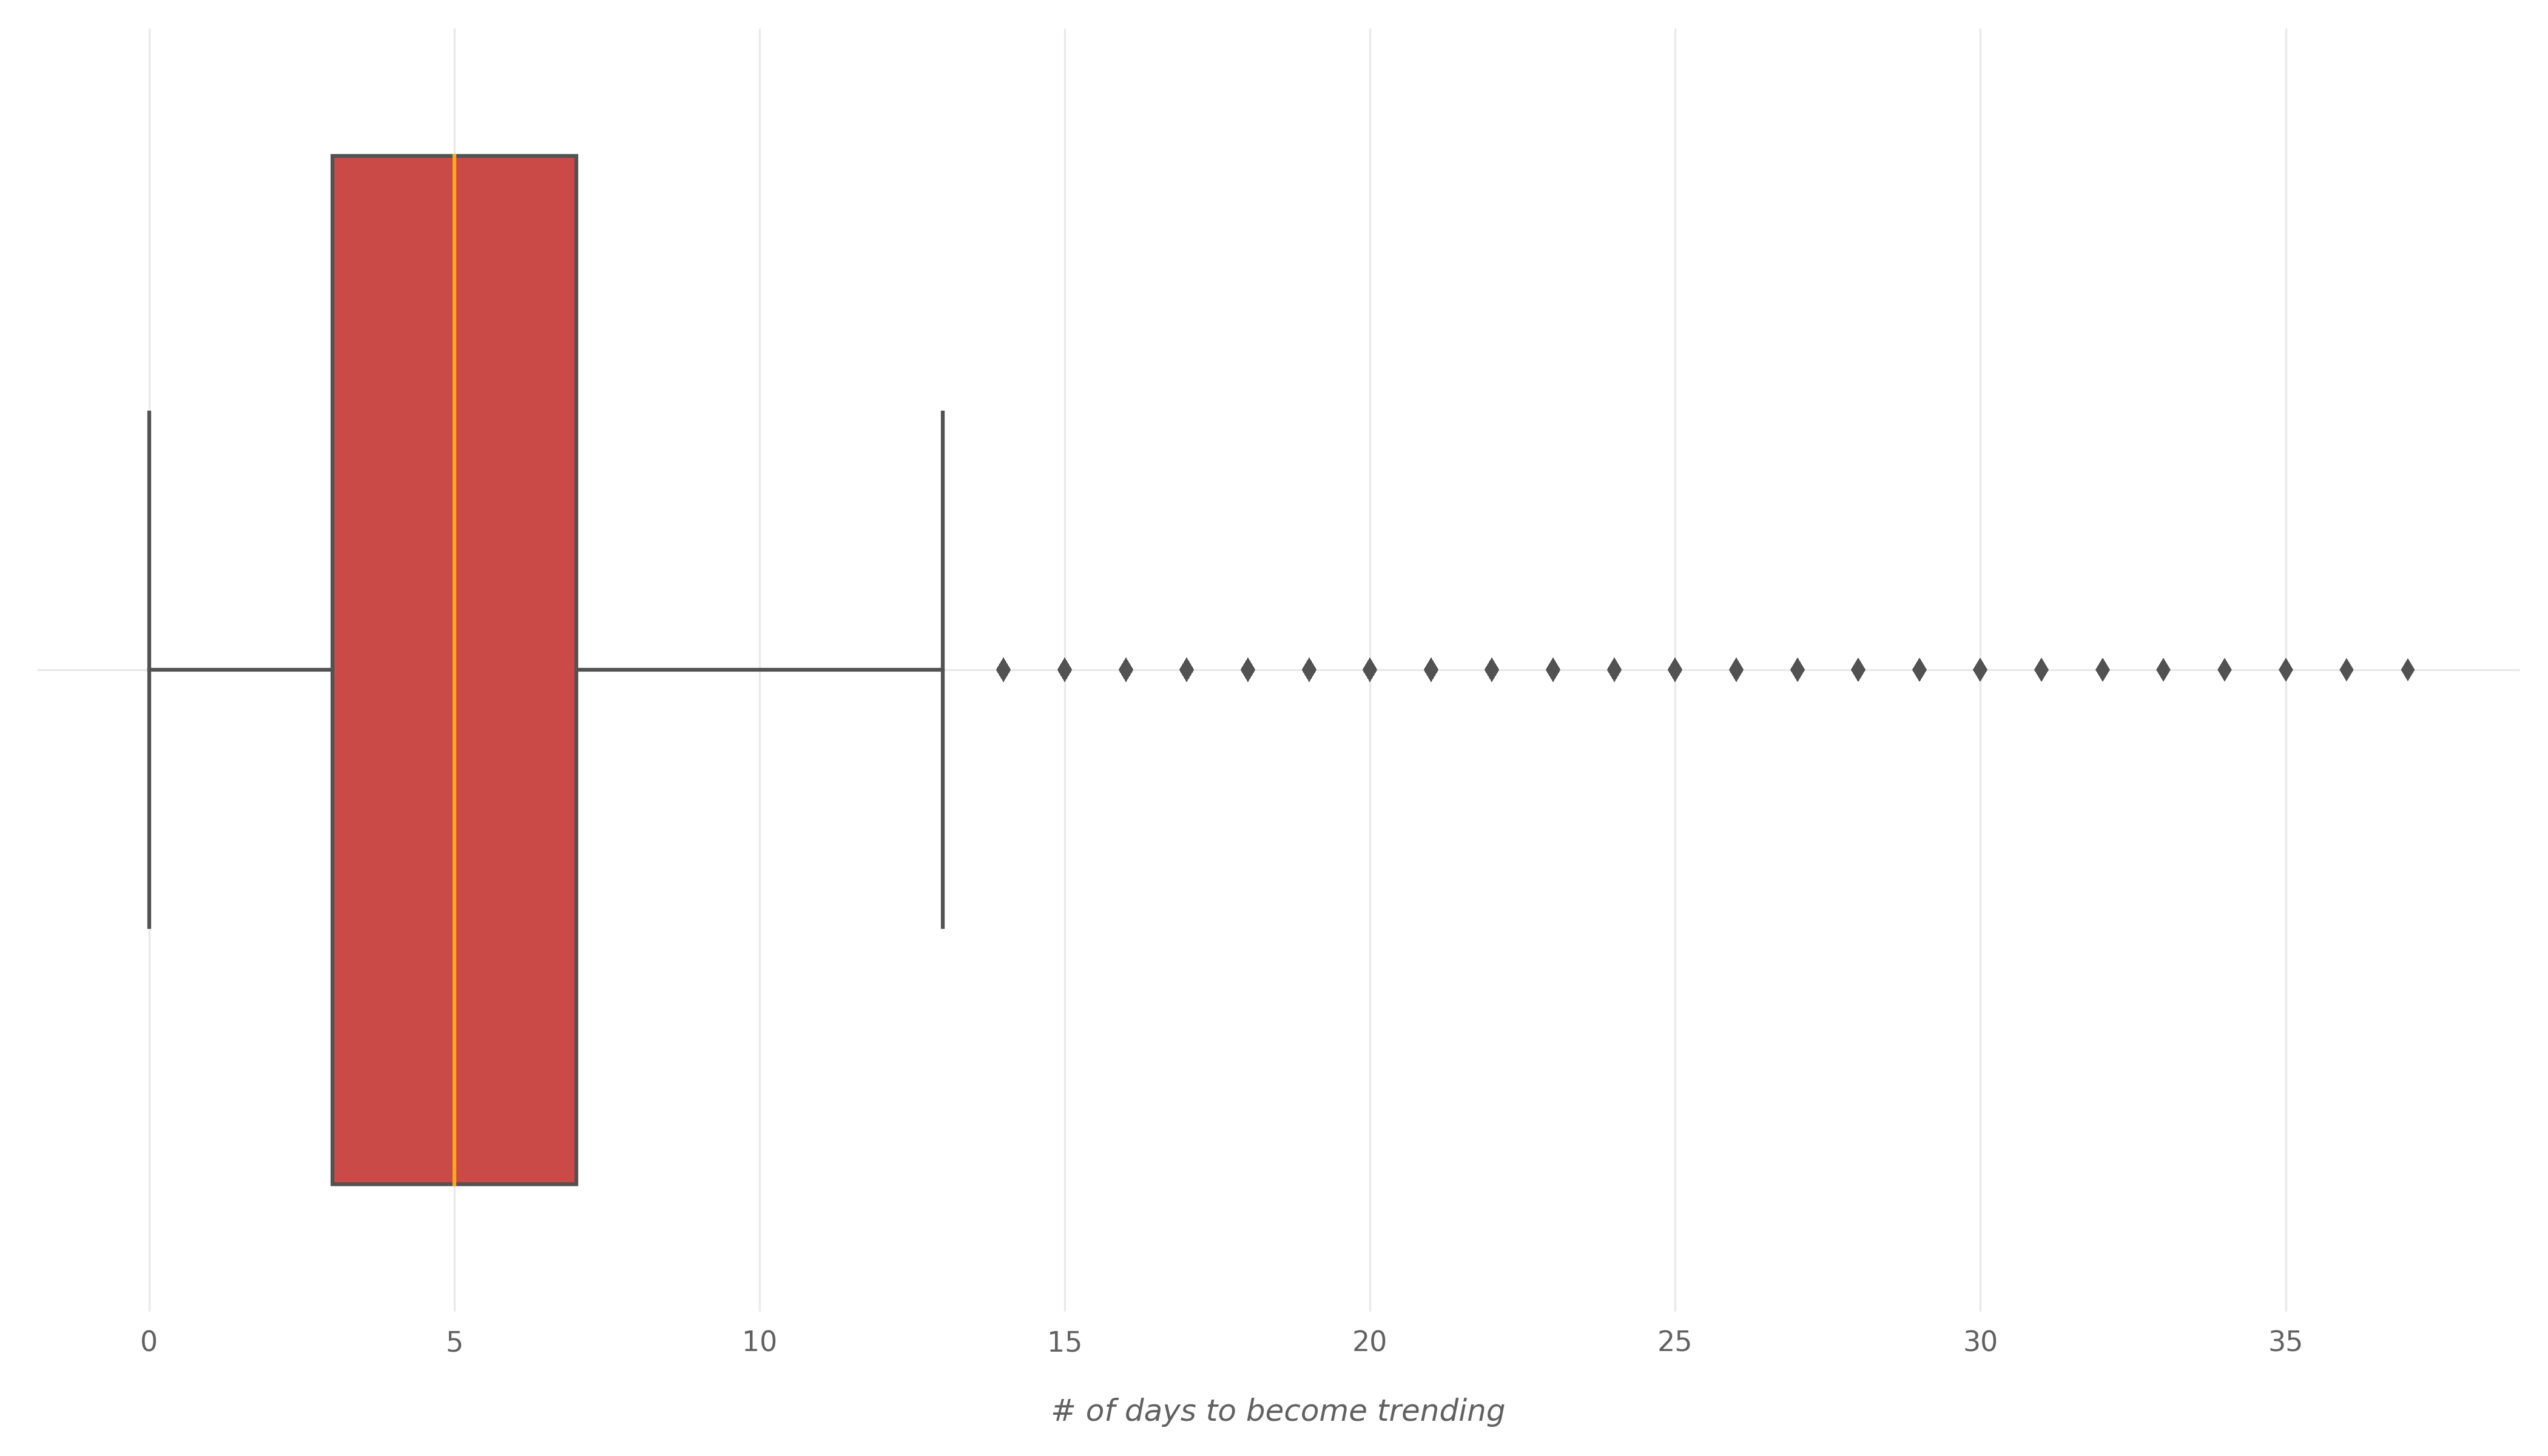
On average, a video appears on the trending list after 5.6 days of publishing it. Also, 95% of the videos took less than 13 days to appear on the trending list. We can also see that there were some videos that appeared on the trending list in less than a day.
Now if we consider only the first appearance of a video on the trending list, we get this box plot:
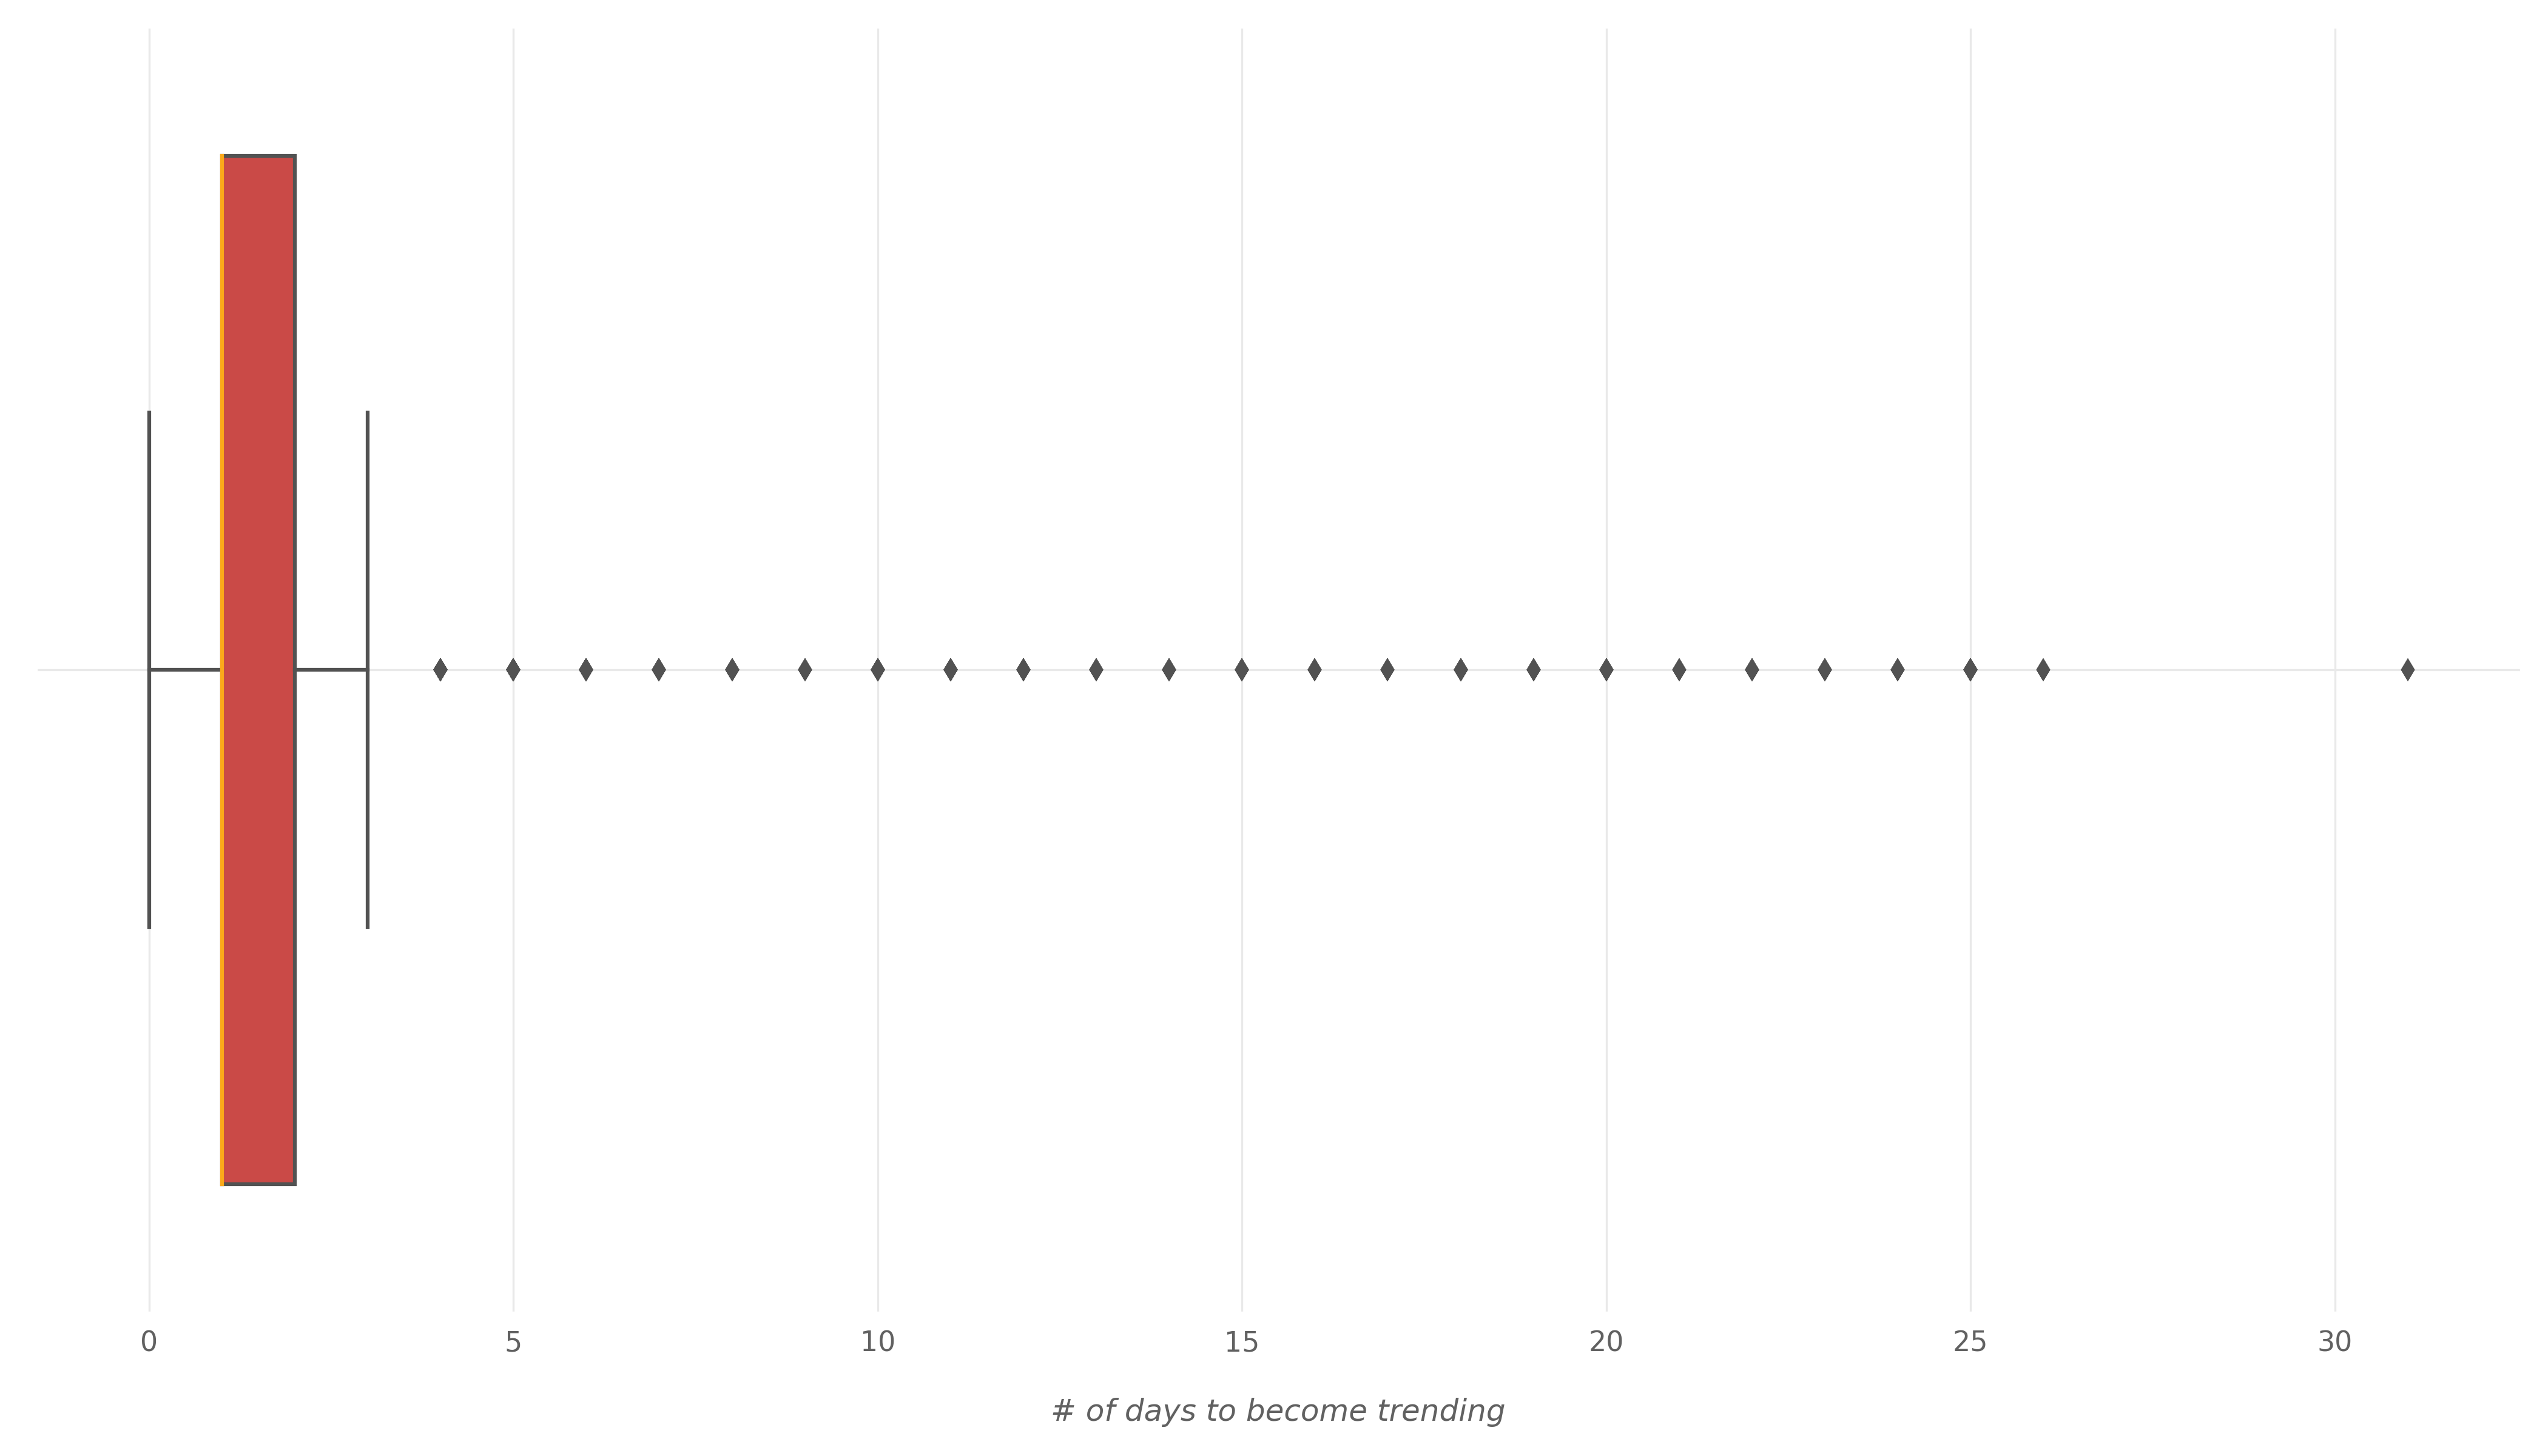
In this case, the video takes on average 1.5 days to become trending. And 97% of the videos appeared on the trending list in less than 2 days after they were published.
Trending Videos Descriptions
How Long is the Description?
We know that each YouTube video can have a description and that the maximum length of the description is 5,000 characters. Now we ask: How long are the descriptions of trending videos? The box plot below tells us the answer:
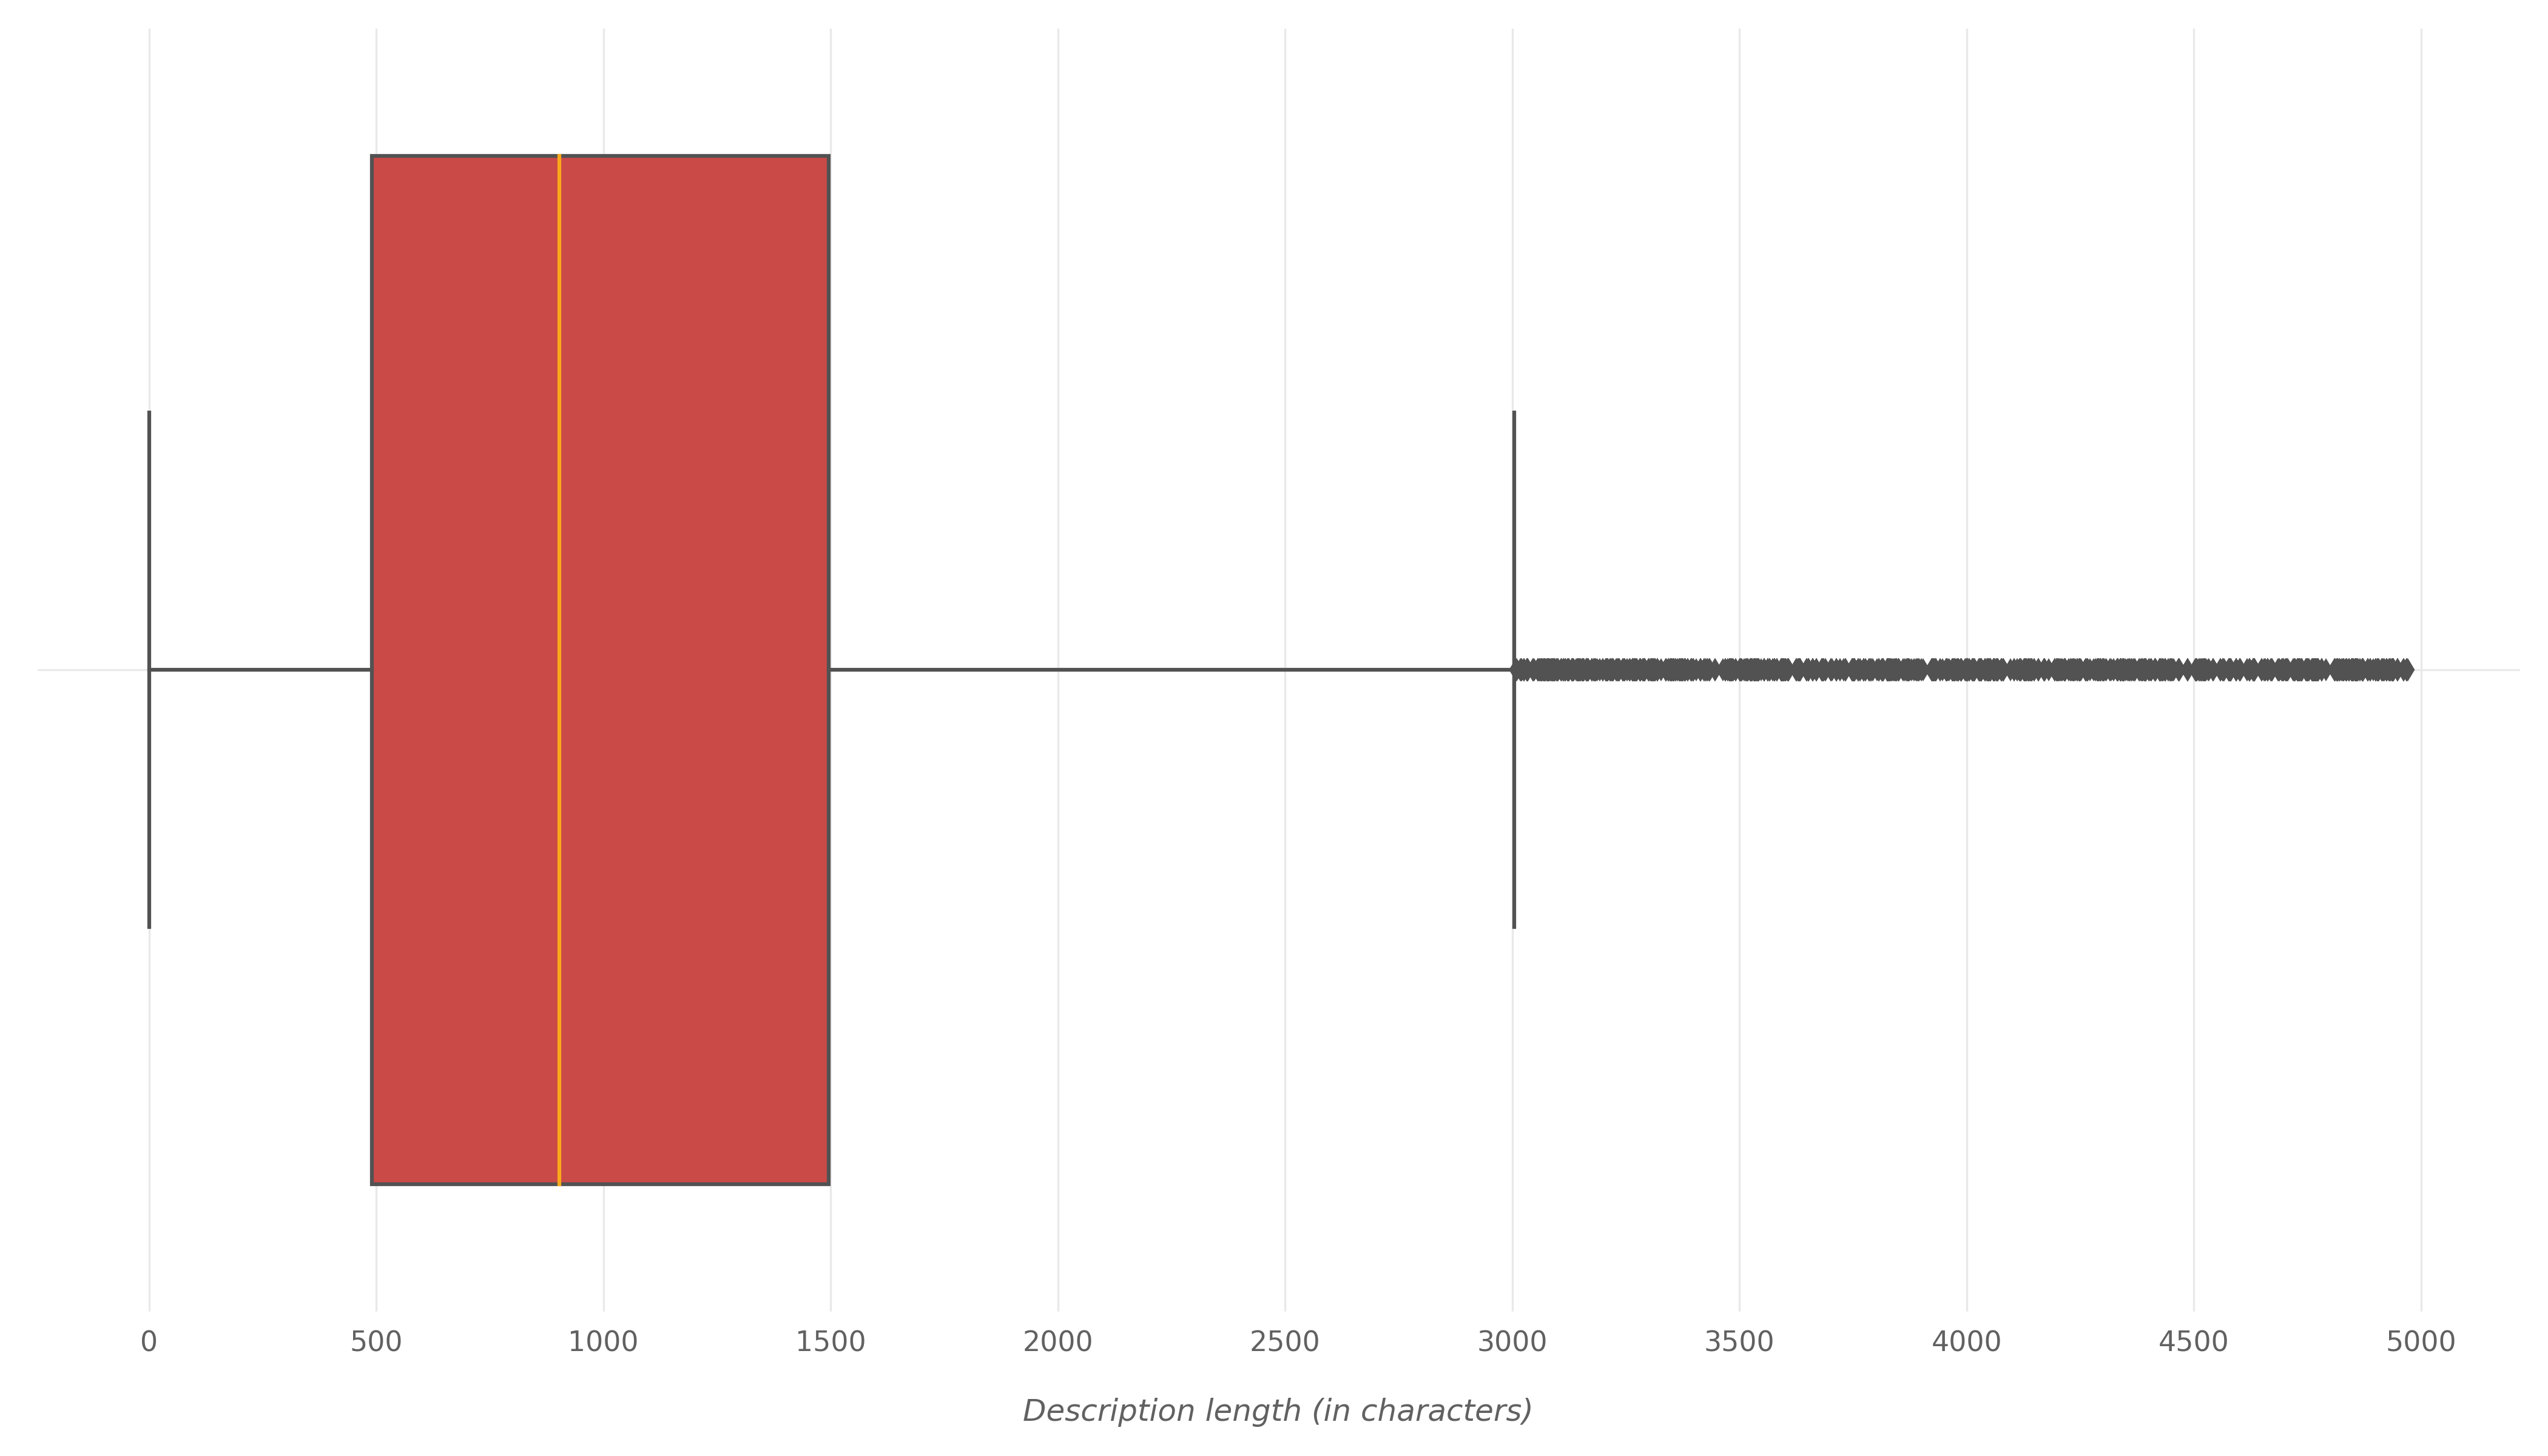
Here are some facts about trending videos descriptions:
- The average description length is 1,129 characters
- Only 281 videos had no description
- 95% of the videos had less than 2,875 characters in their descriptions
Most Common Words in Trending Videos Descriptions
The following word cloud shows the most common words in the descriptions of trending videos similar to what was done for video titles. This word cloud shows the most common 100 words after excluding stop words and after expanding the contractions (See the titles section above for the meaning of that).
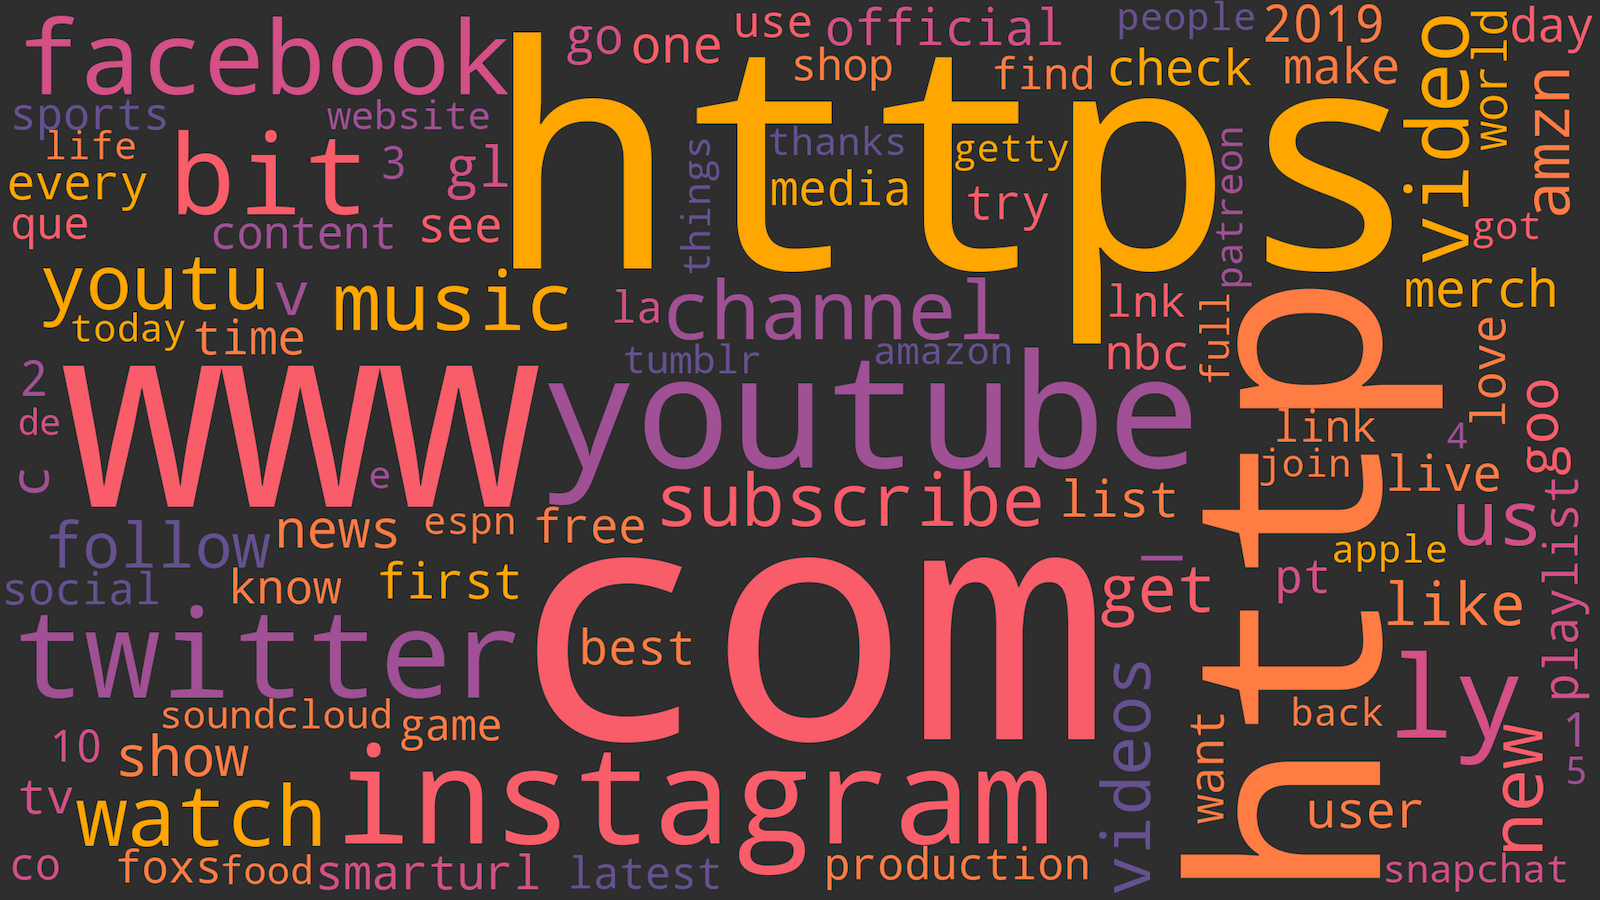
We can see that “https”, “http”, “com”, and “www” are among the most common words. This indicates that trending videos descriptions contain many URLs. We also can see that names of social media platforms like “instagram”, “twitter”, and “facebook” are quite common also. This indicates that trending videos descriptions contain links to these platforms.
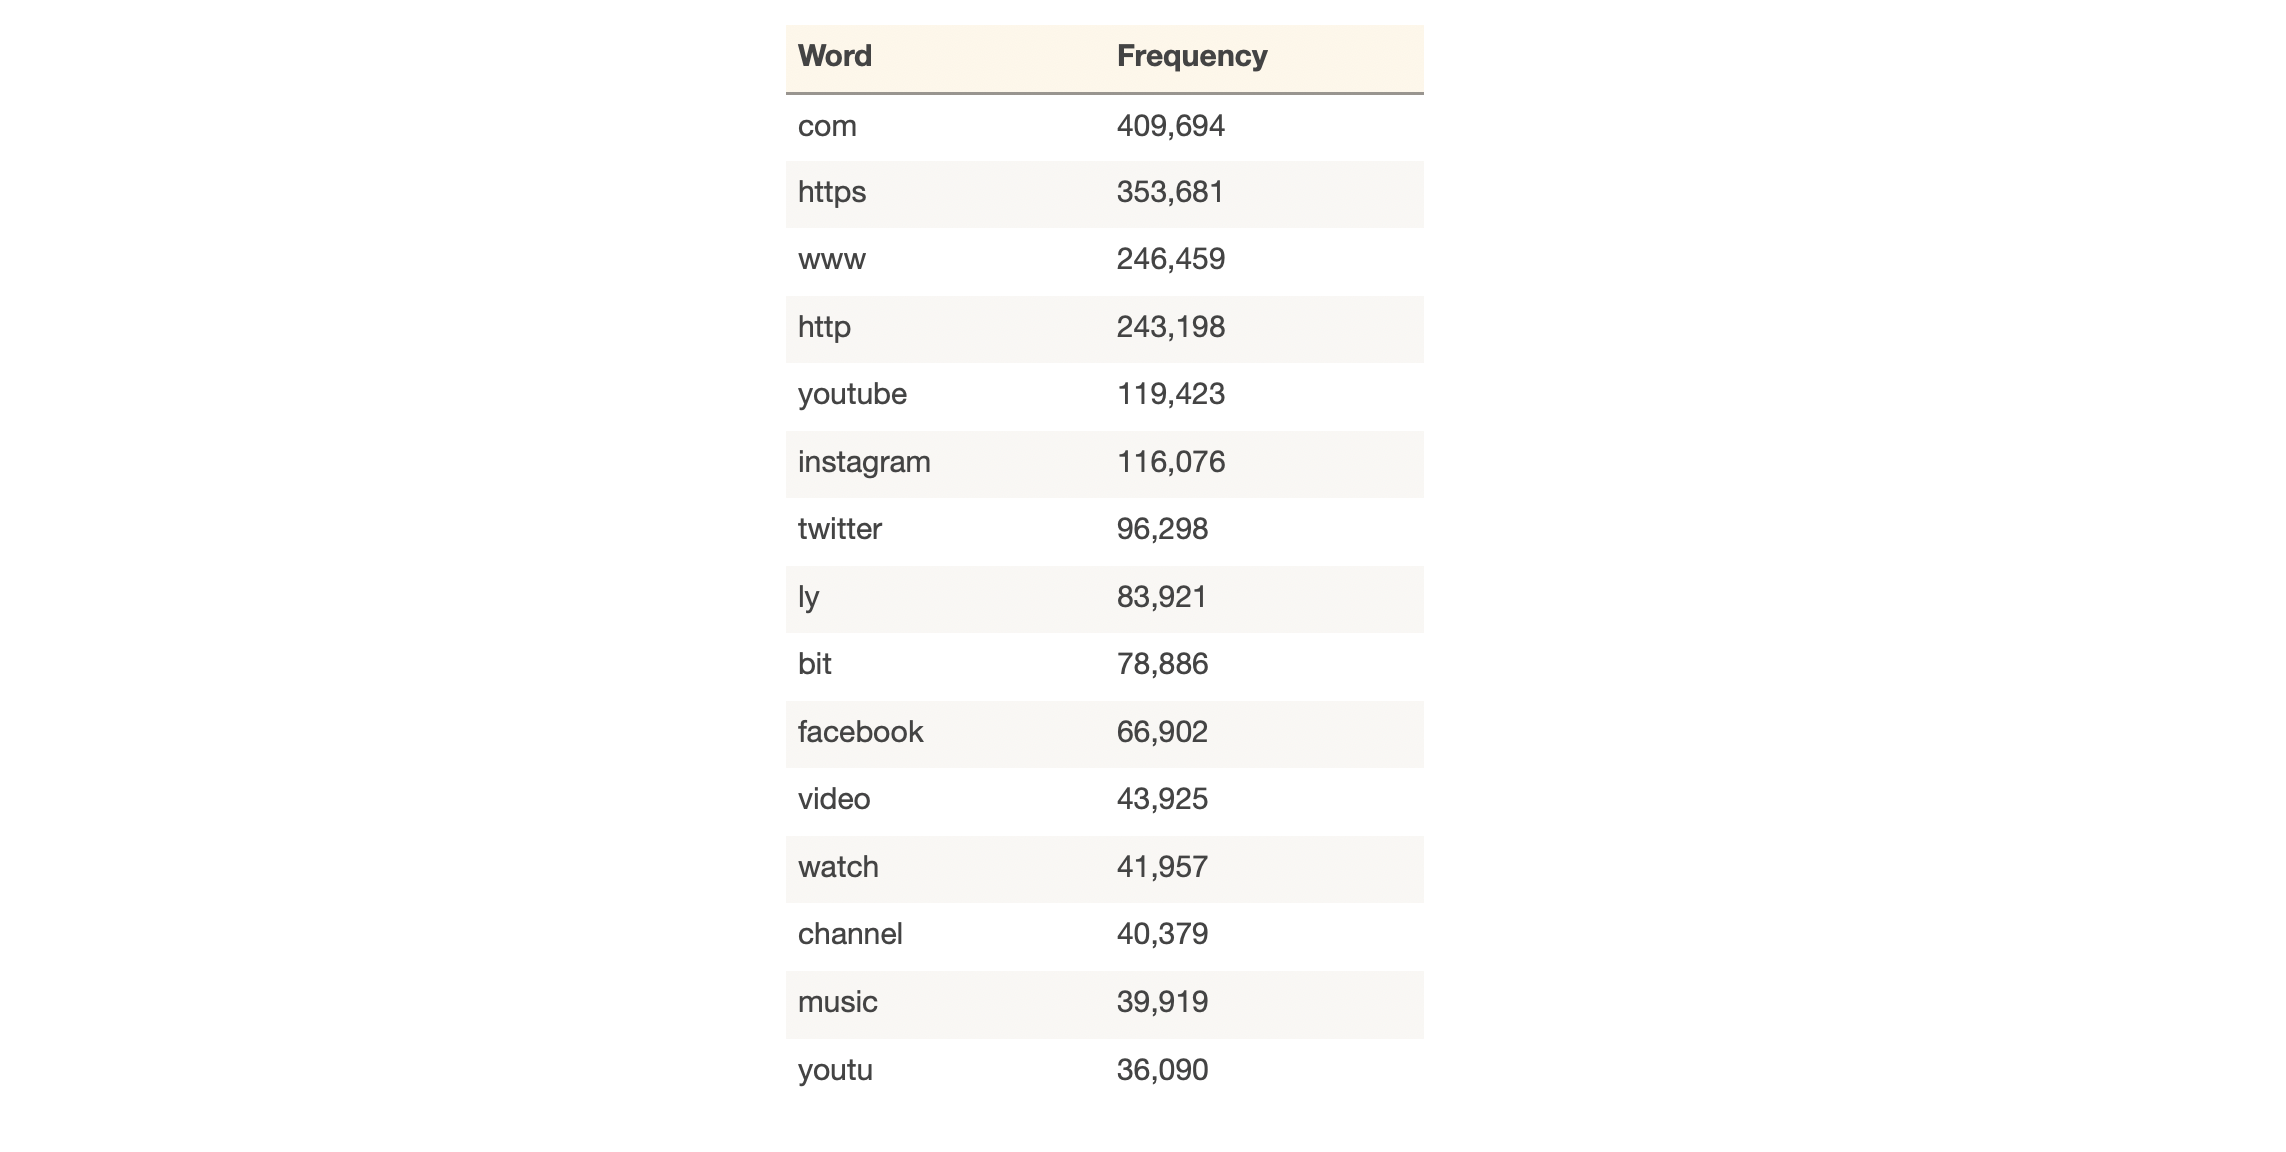
The following table shows the 10 most common words in the descriptions of trending videos with their exact frequency:
And the following word cloud shows the most common 2-grams in trending videos descriptions (Again, see the titles section above for the meaning of 2-grams):
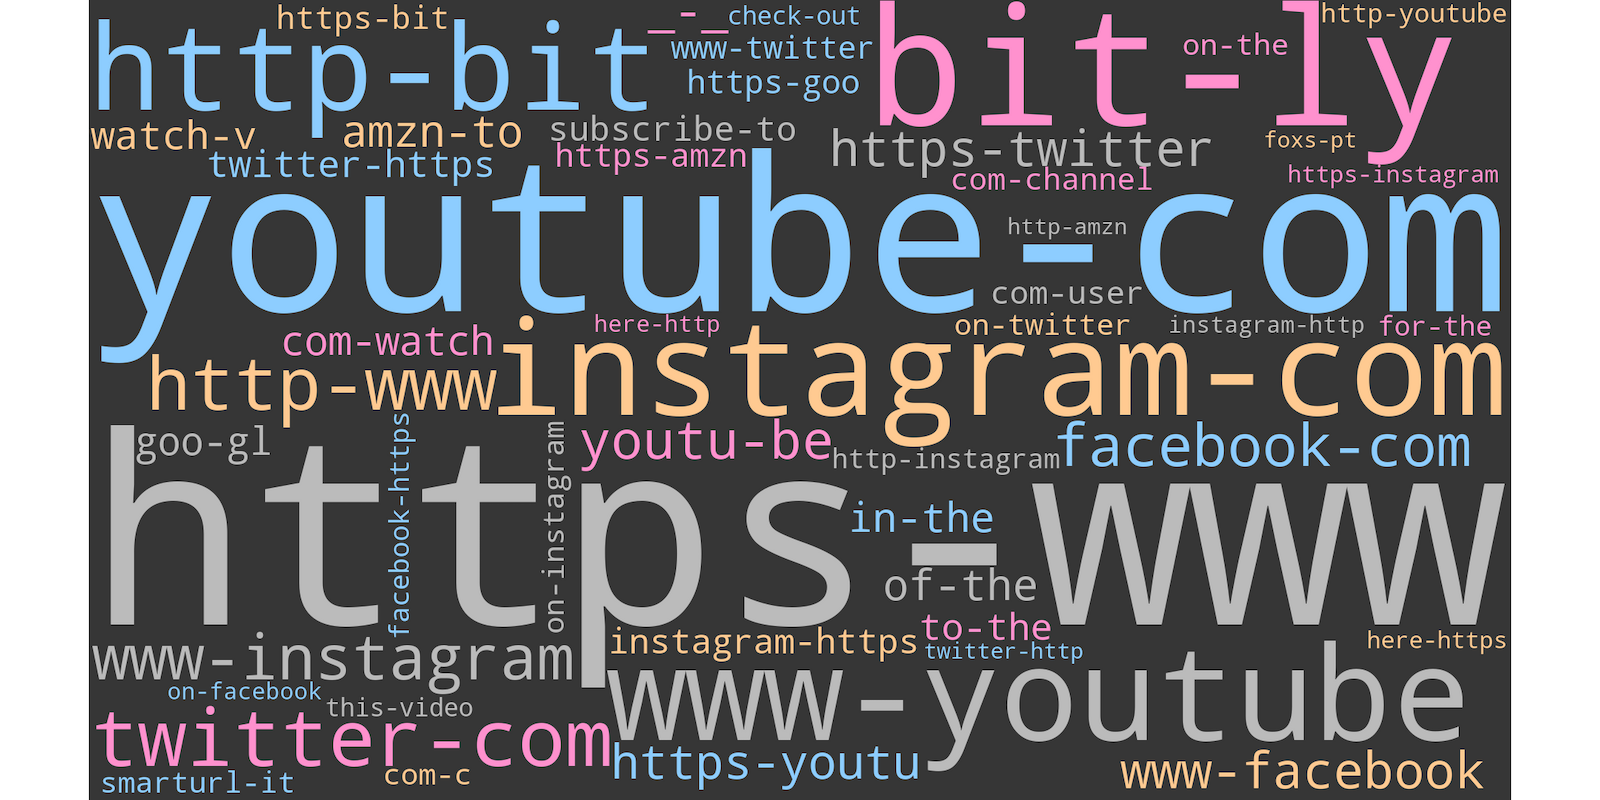
We can see that websites URLs are very common 2-grams in trending videos descriptions.
Does Trending Videos Descriptions Contain Hashtags?
How many trending videos contain hashtags (like #abc) in their descriptions? It turns out that 33% of trending videos include hashtags in their descriptions. This leads us to another question: How many hashtags do those descriptions have? The following box plot answers this question. It shows the distribution of the number of hashtags in the description:
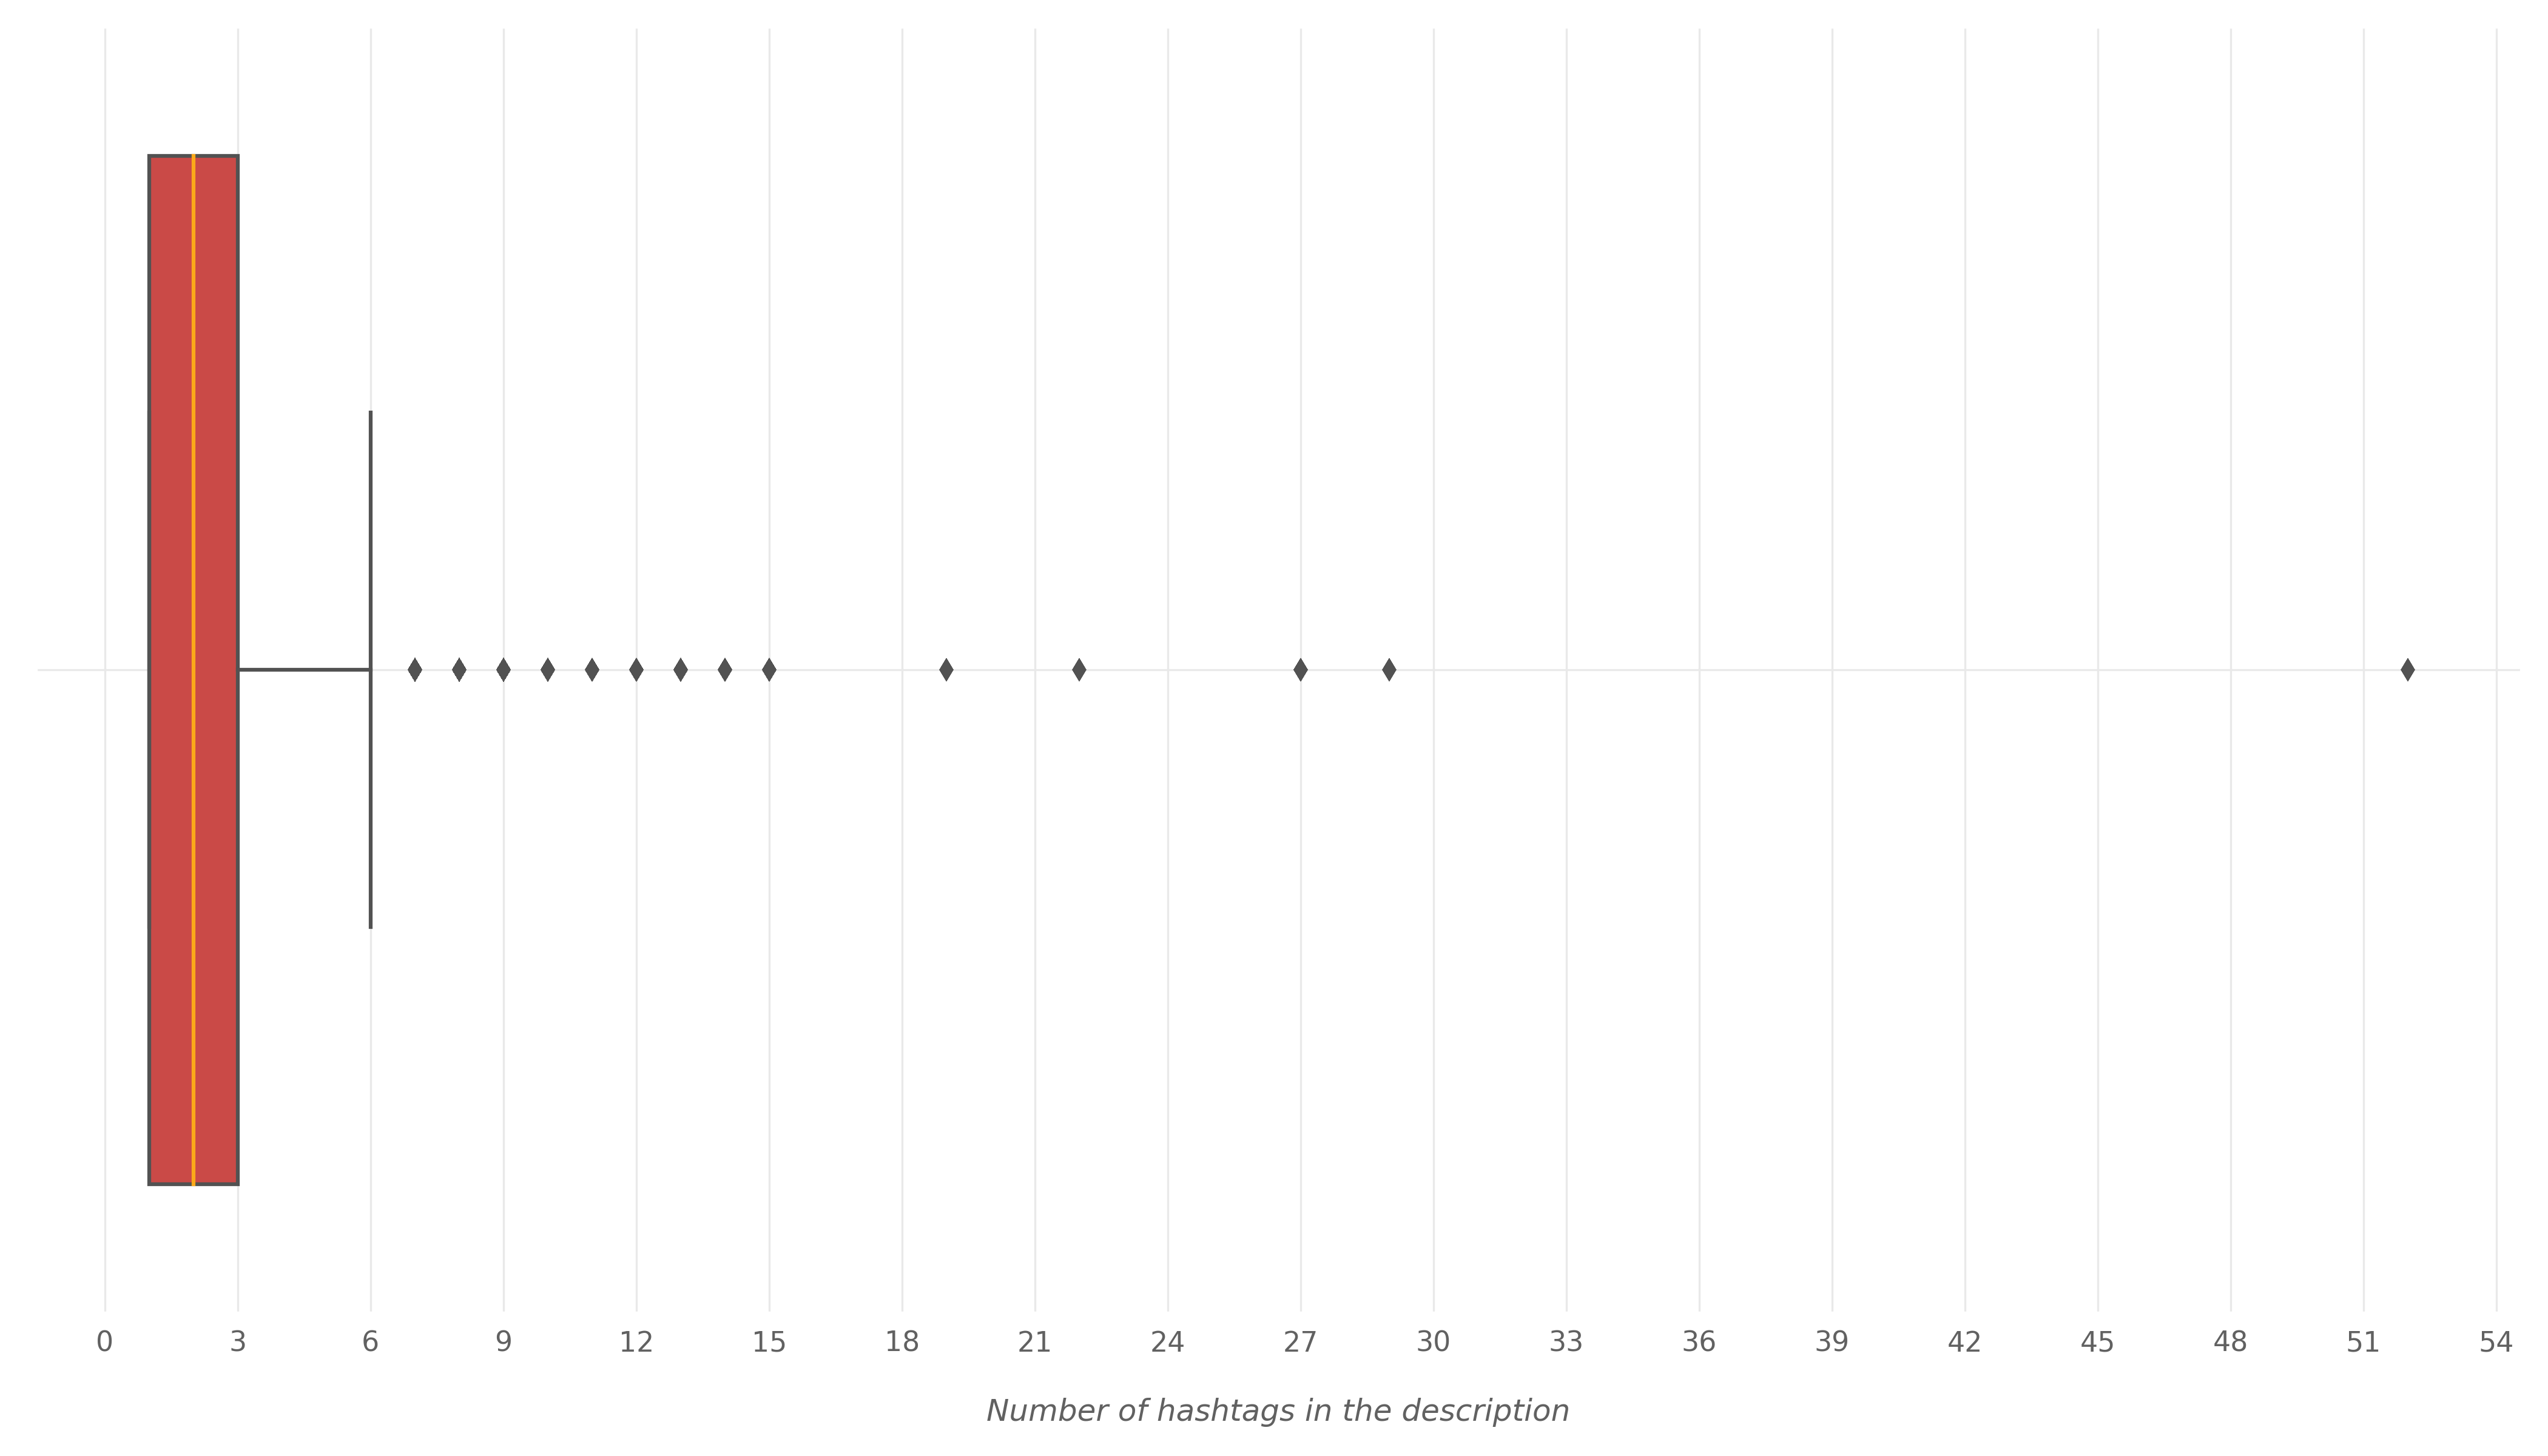
Note that this plot considers only videos that have hashtags in their descriptions. We can see that most of these videos have less than 6 hashtags. The average number of hashtags in description is 2.7 hashtags. And 94% of those videos have less than 6 hashtags in the description.
Trending Videos Tags
When you upload a video to YouTube, you can add tags to the video. Tags are not displayed on the video page; you can see them by viewing the source code of the page or by using browser extensions such as TubeBuddy and vidIQ. There is a lot of debate on whether tags affect how YouTube algorithm deals with the video. Does adding effective tags make the algorithm show the video to more people on YouTube? Do tags affect where a video appears in the search results? No one knows certainly. When you upload a video, you find this written above the tag section:
Tags can be useful if content in your video is commonly misspelled. Otherwise, tags play a minimal role in helping viewers find your video.
But if that was true, why would YouTube add a lot of tags to their videos? For example, YouTube Rewind video of 2019 has all of these tags:
Rewind, Rewind 2019, youtube rewind 2019, #YouTubeRewind, MrBeast, PewDiePie, James Charles, Shane Dawson, CaseyNeistat, RiceGum, Simone Giertz, JennaMarbles, Lilly Singh, emma chamberlain, The Try Guys, Fortnite, Minecraft, Roblox, Marshmello, Garena Free Fire, GTA V, Lachlan, Anaysa, jeffreestar, Noah Schnapp, Jennelle Eliana, T-Series, Azzyland, LazarBeam, Dude Perfect, David Dobrik, KSI, NikkieTutorials, Kurzgesagt, Jelly, Ariana Grande, Billie Eilish, BLACKPINK, Year in Review
Apart from this discussion, this following violin plot shows the distribution of the number of tags in trending videos. This plot lets us know how many tags trending videos have:
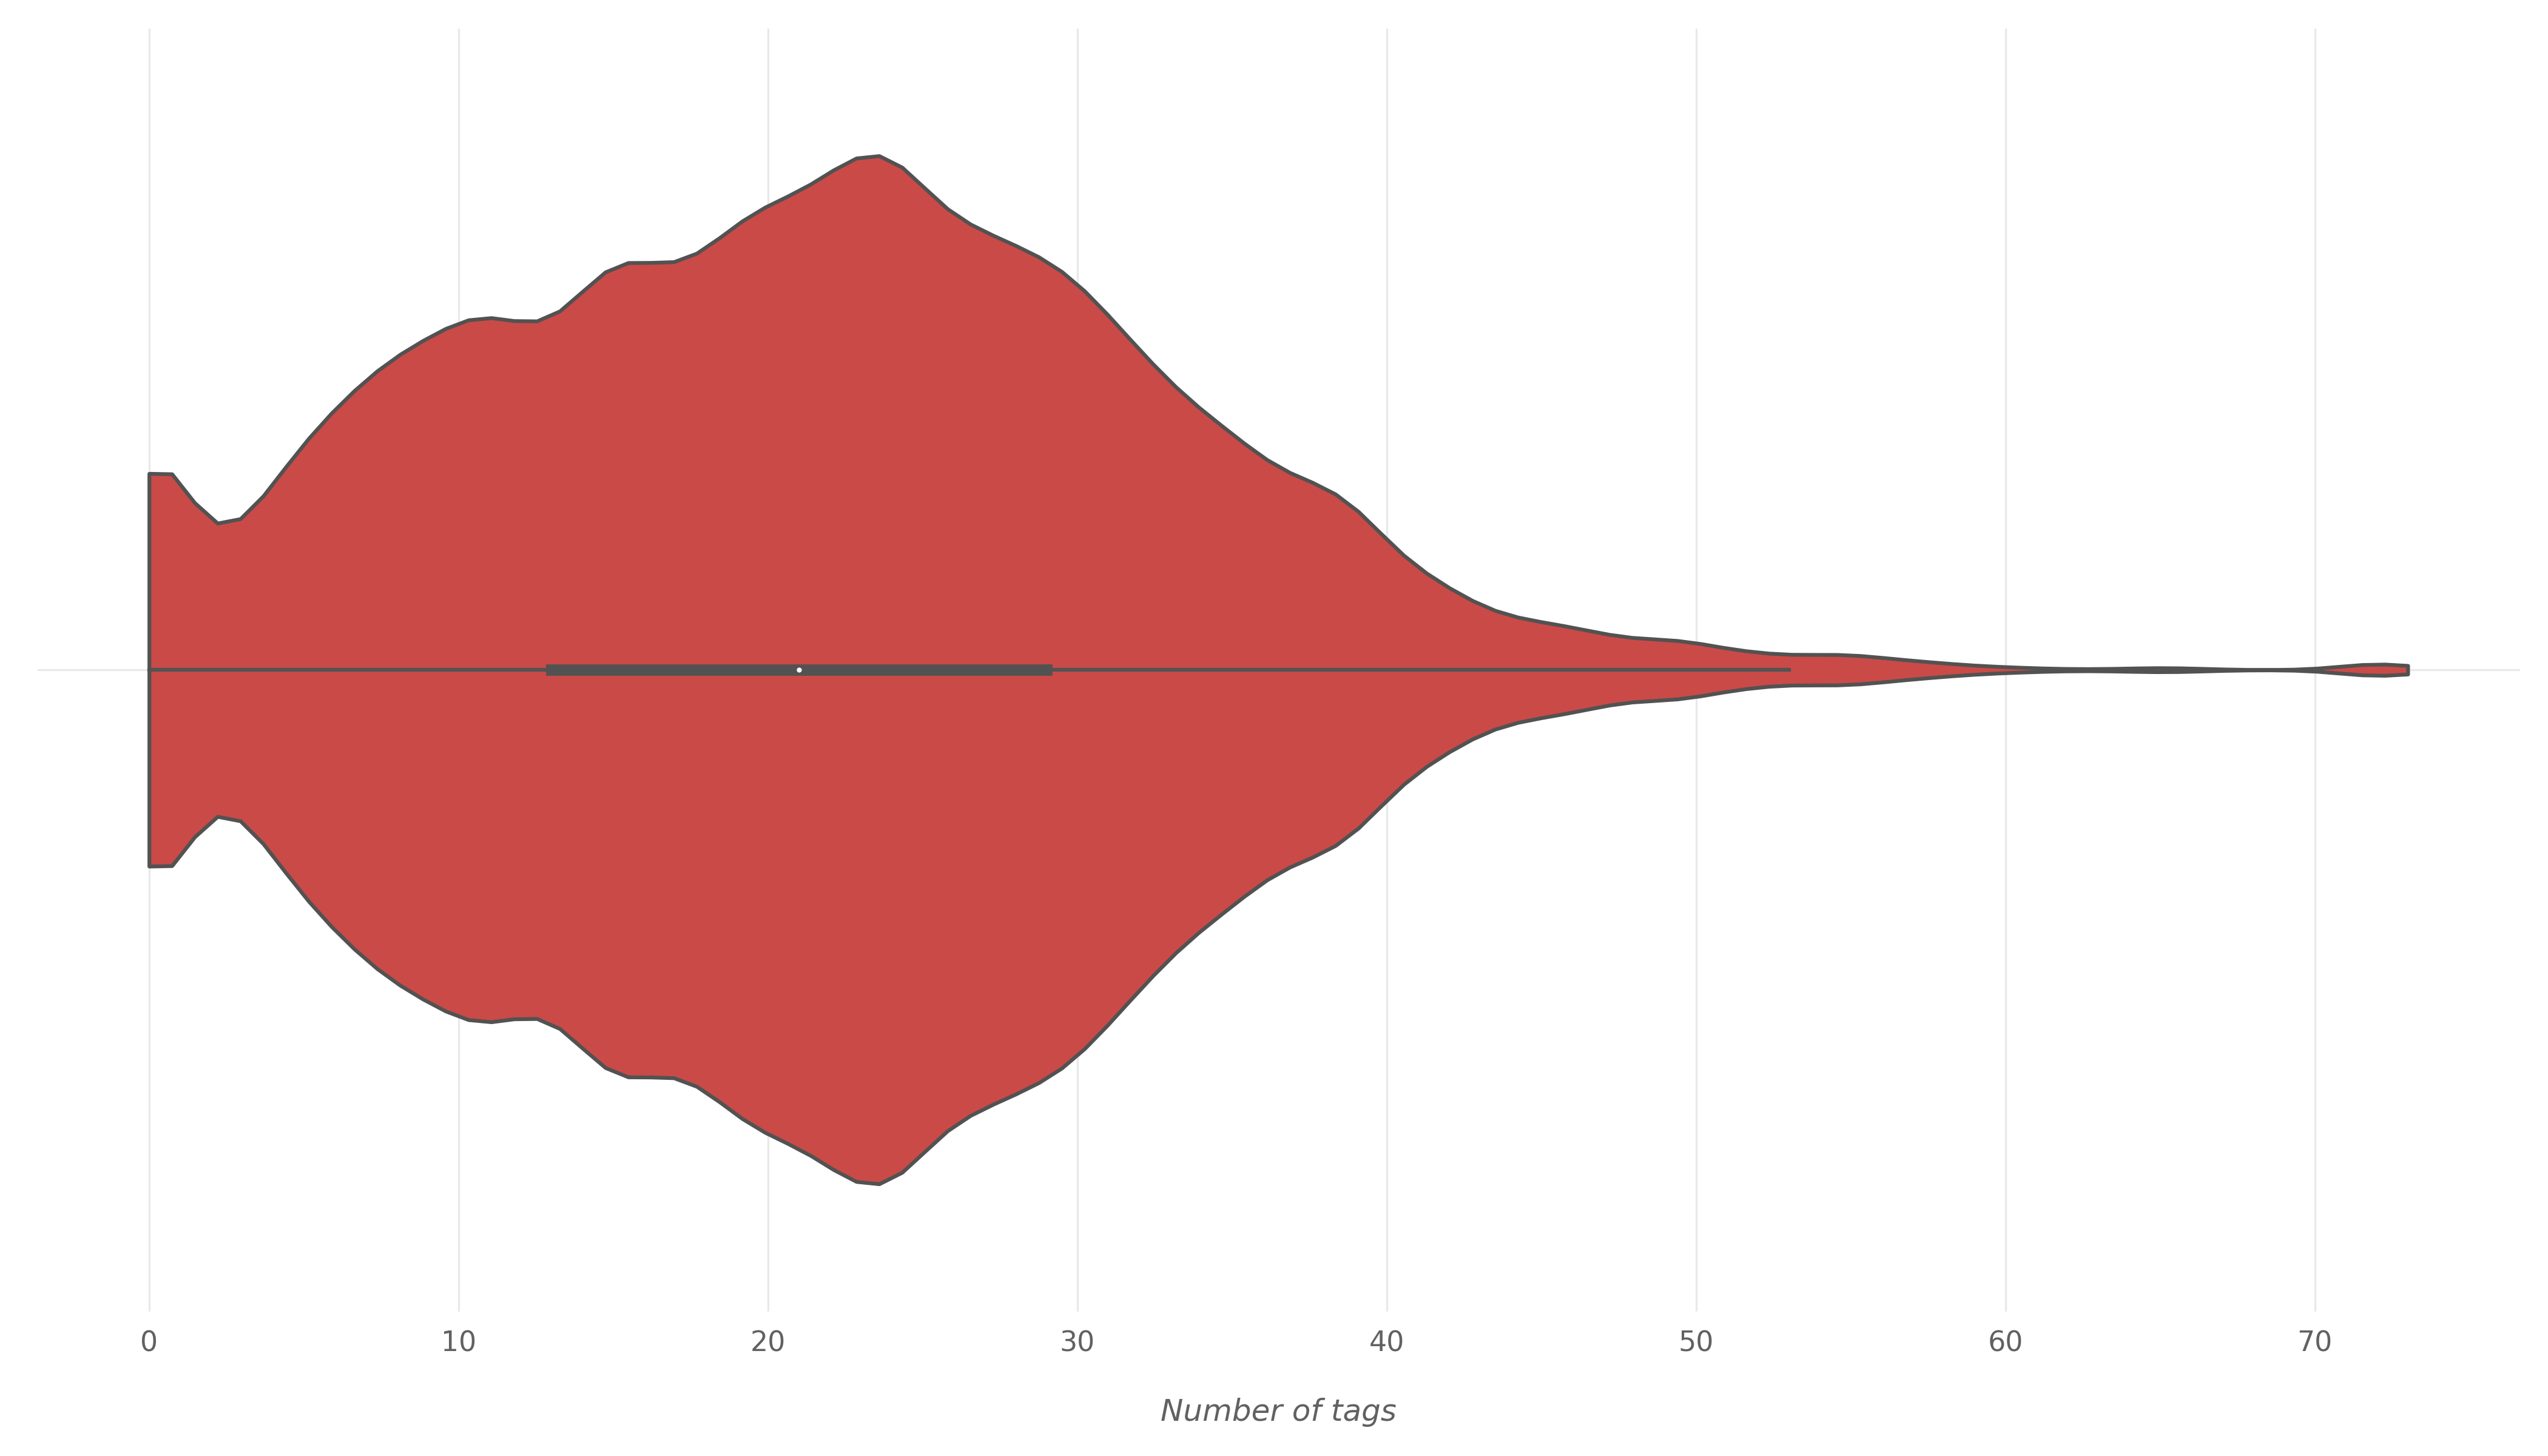
We can see that most of trending videos have between 10 and 30 tags. Here are some interesting facts about trending videos tags:
- The average number of tags a trending video has is 21 tags.
- Only 3.5% of trending videos have no tags.
- The minimum number of tags a trending video has is 0.
- The maximum number of tags a trending video has is 73.
After we explored the number of tags for trending videos, let’s see now the length of the tags of trending videos. YouTube allows you to put as many tags as you want, but the limit is 500 characters. So all the tags of a YouTube videos combined must not exceed 500 characters. Let’s see the tags lengths of trending videos.
The following violin plot shows us the distribution of tags length for trending videos:
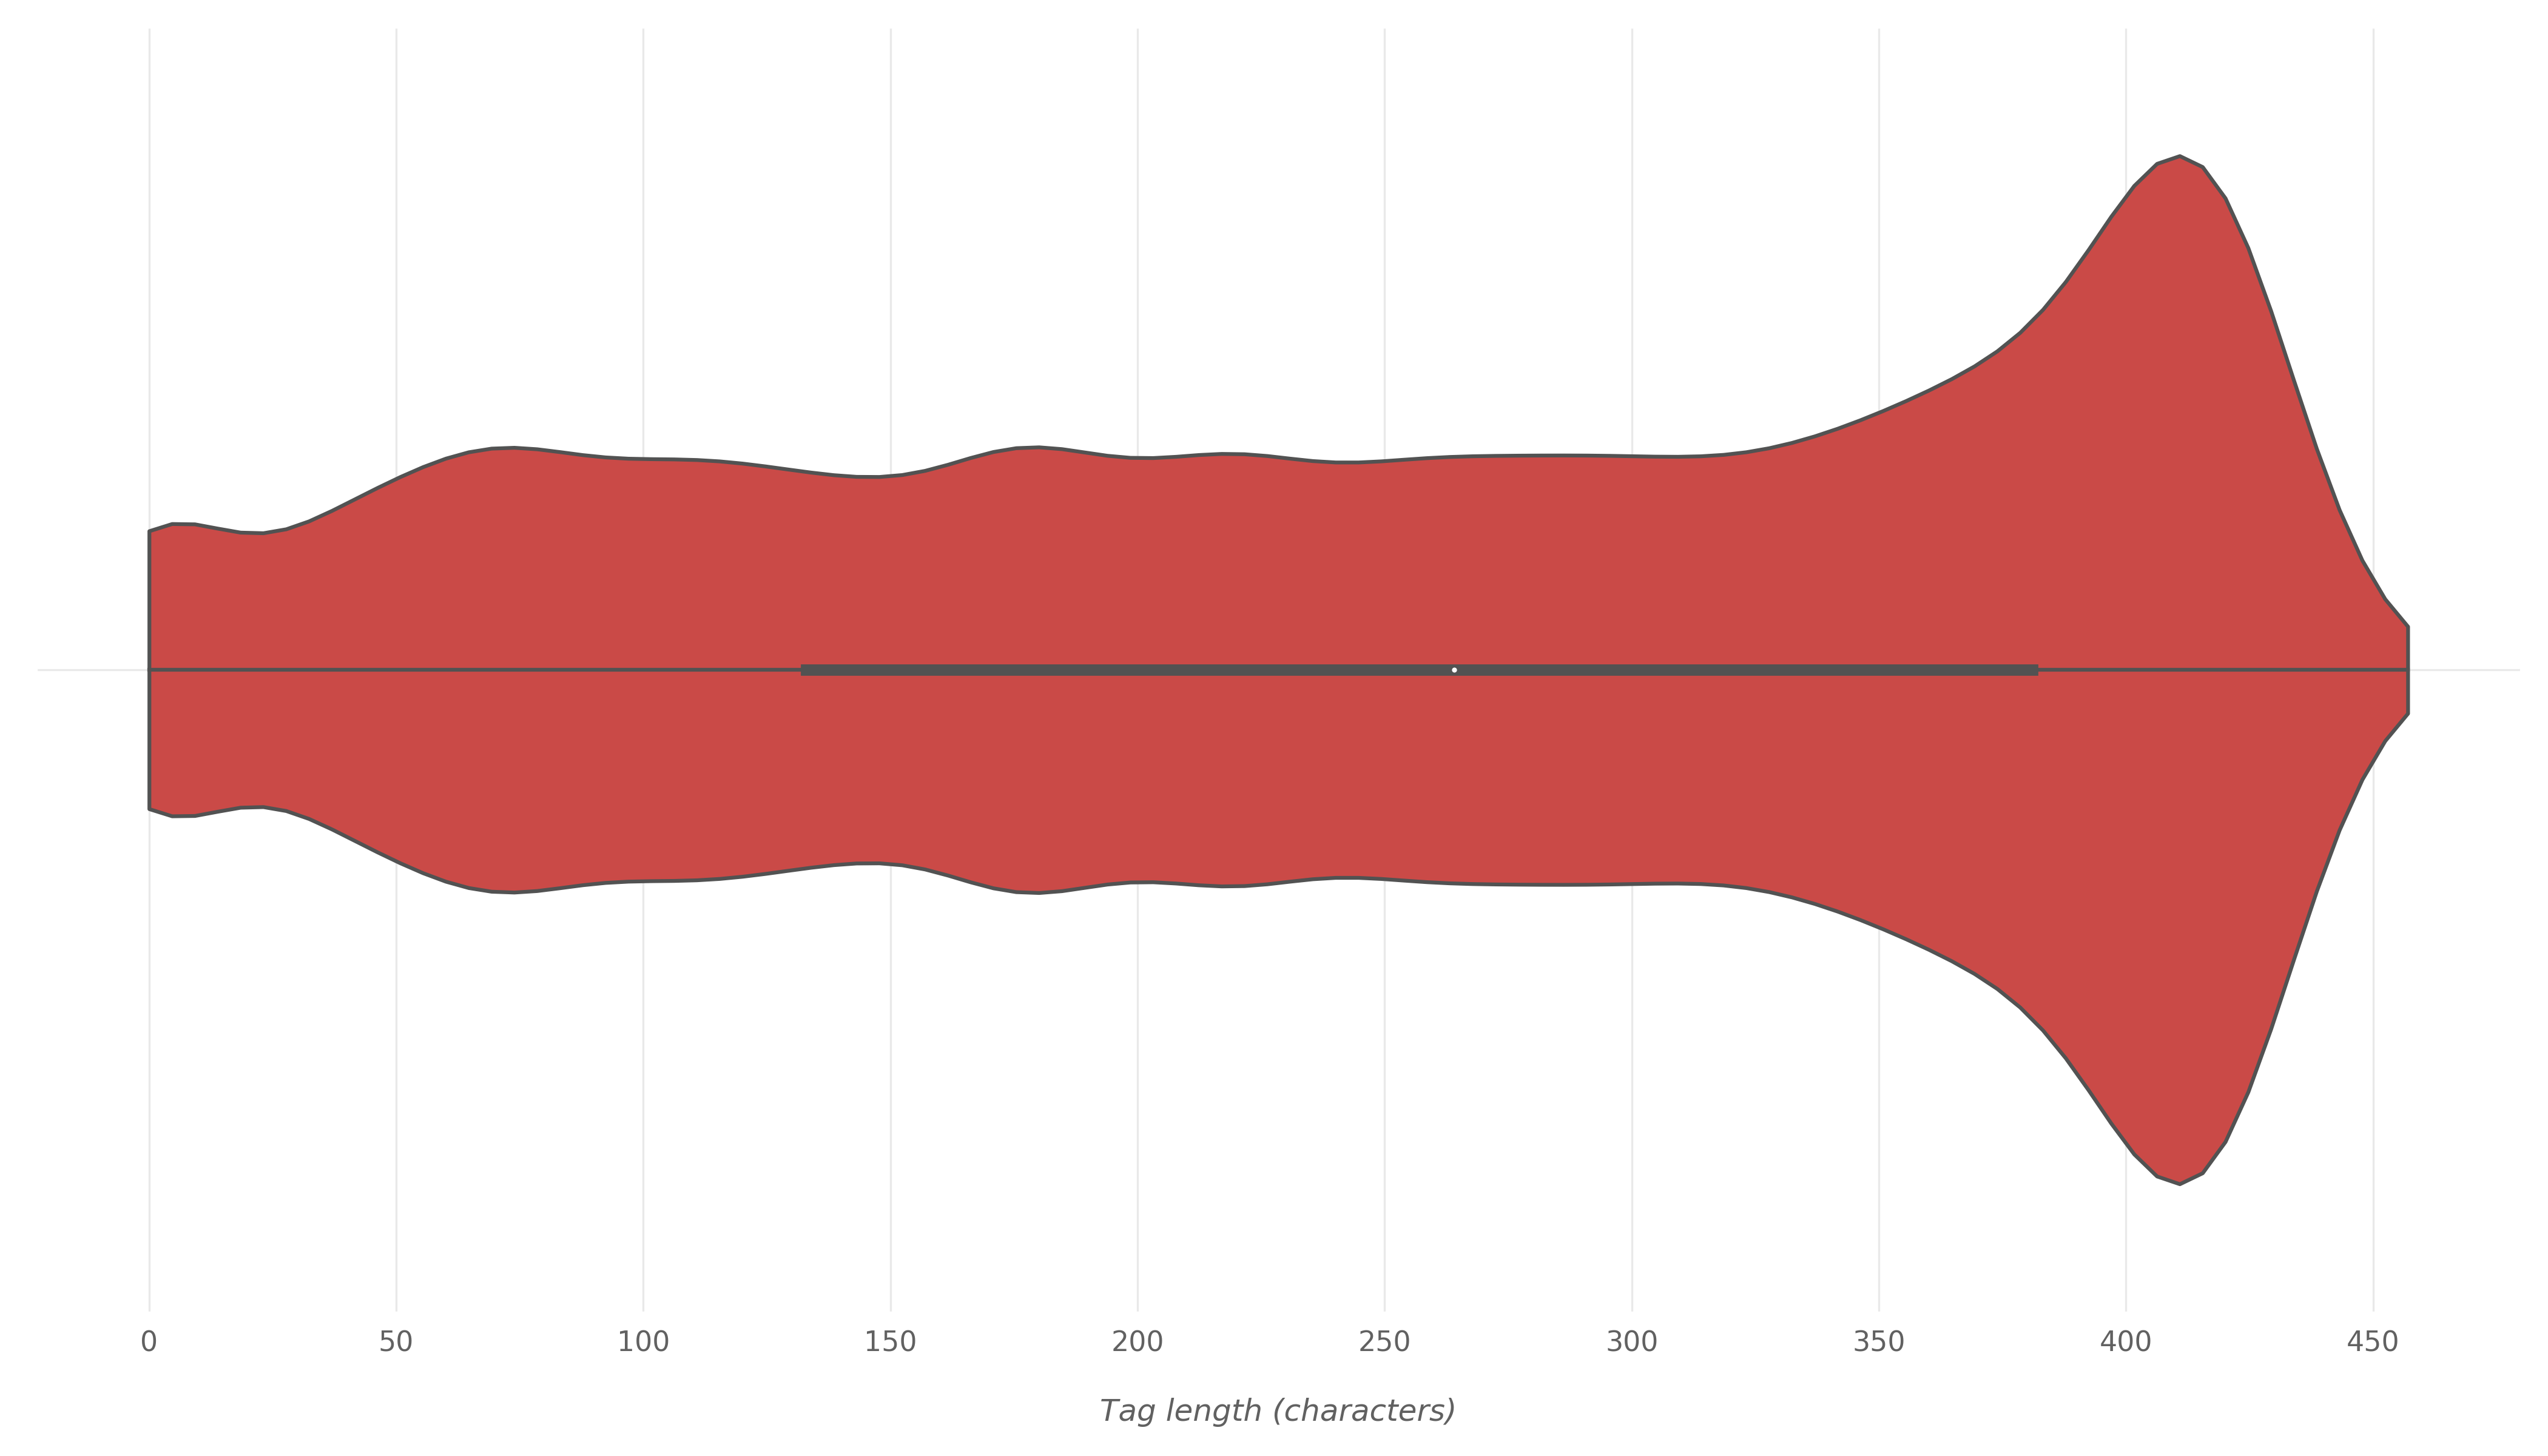
Tags length ranges from 0 to 457. Almost all tags lengths are equally common, but we see the peak between 400 and 450 characters. Here are some facts about tags length of trending videos:
- On average, the length of the tags of a trending video is 251 characters which is half the allowed size of 500 characters.
- The minimum tags length a trending video has is 0 characters.
- The maximum tags length a trending video has is 457 characters.
Most Common Words in Trending Videos Tags
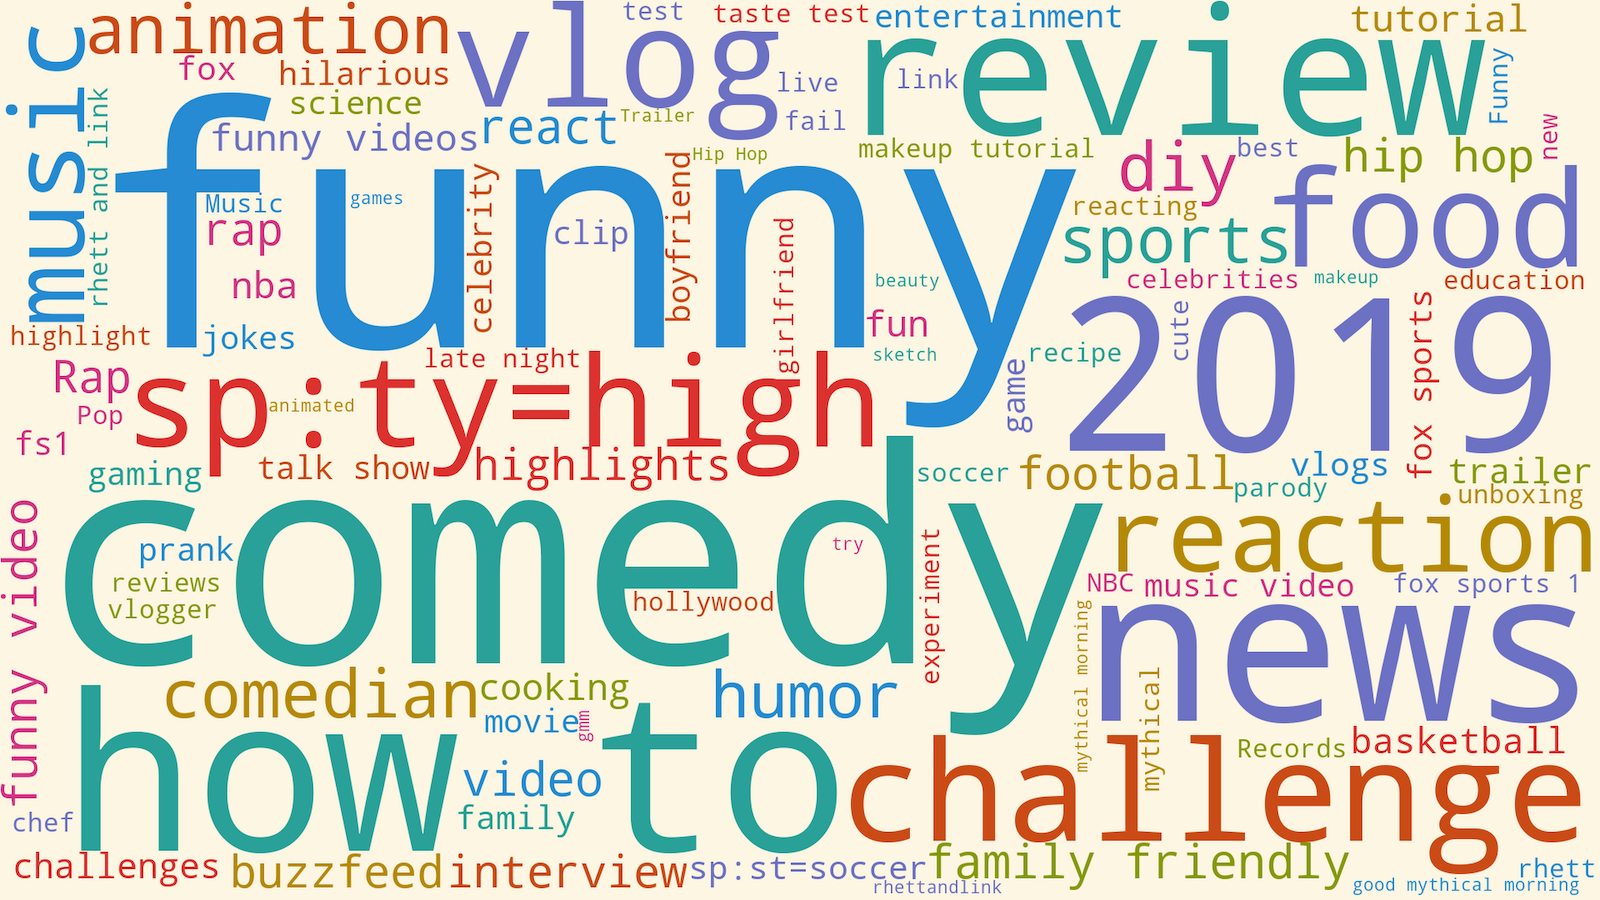
As we did with titles and descriptions, let’s see the most common words in the tags of trending videos. The word cloud below shows us the most common 100 words:
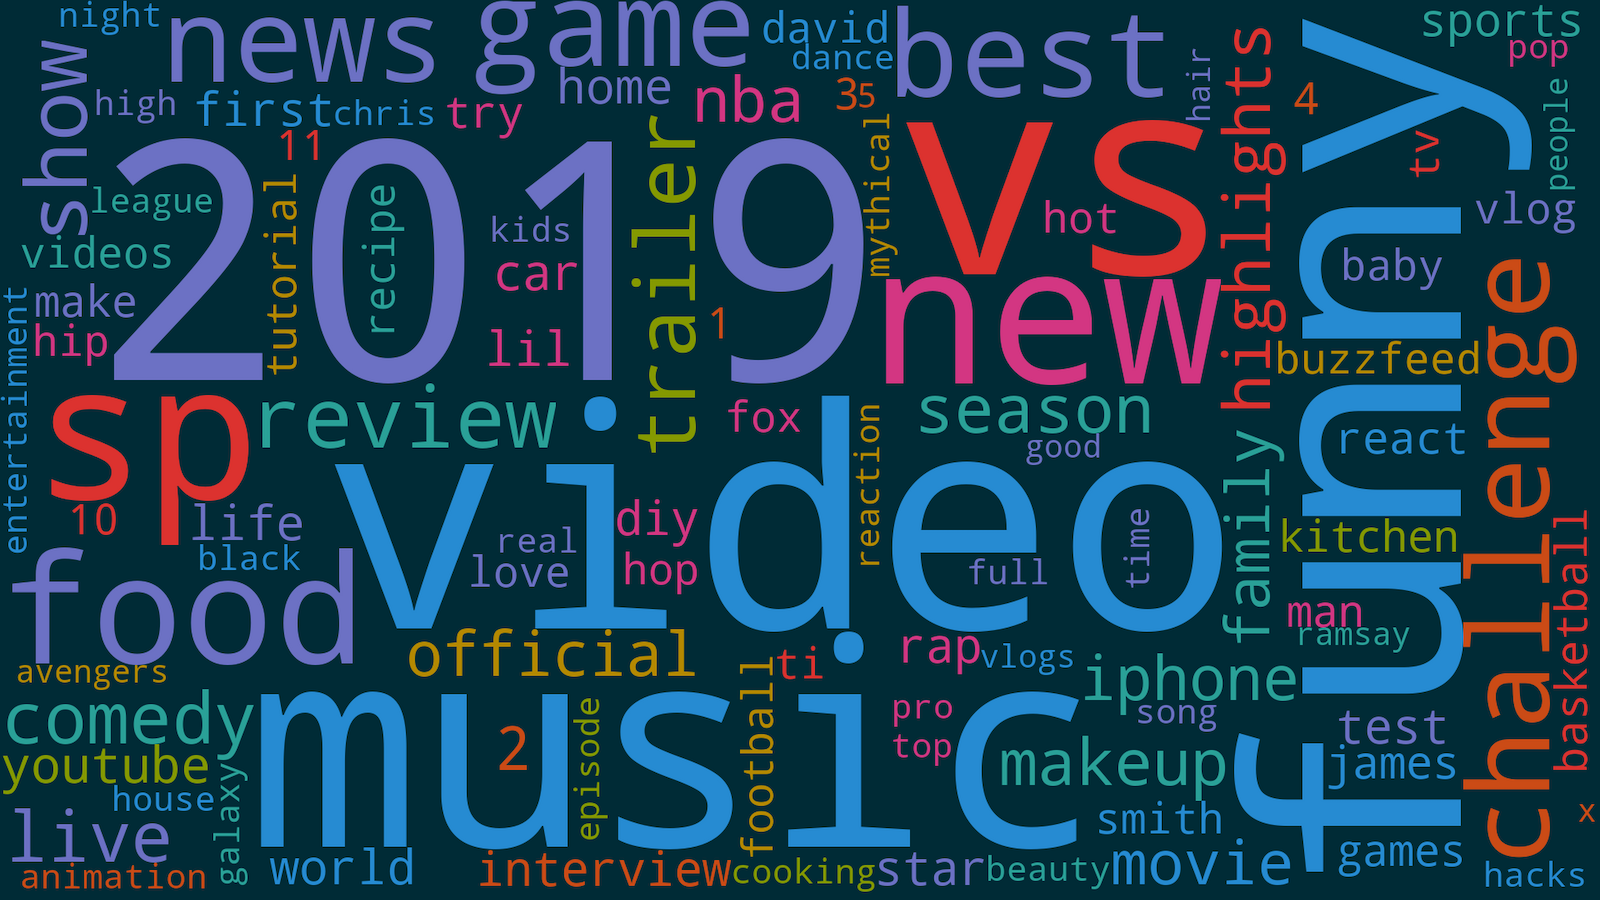
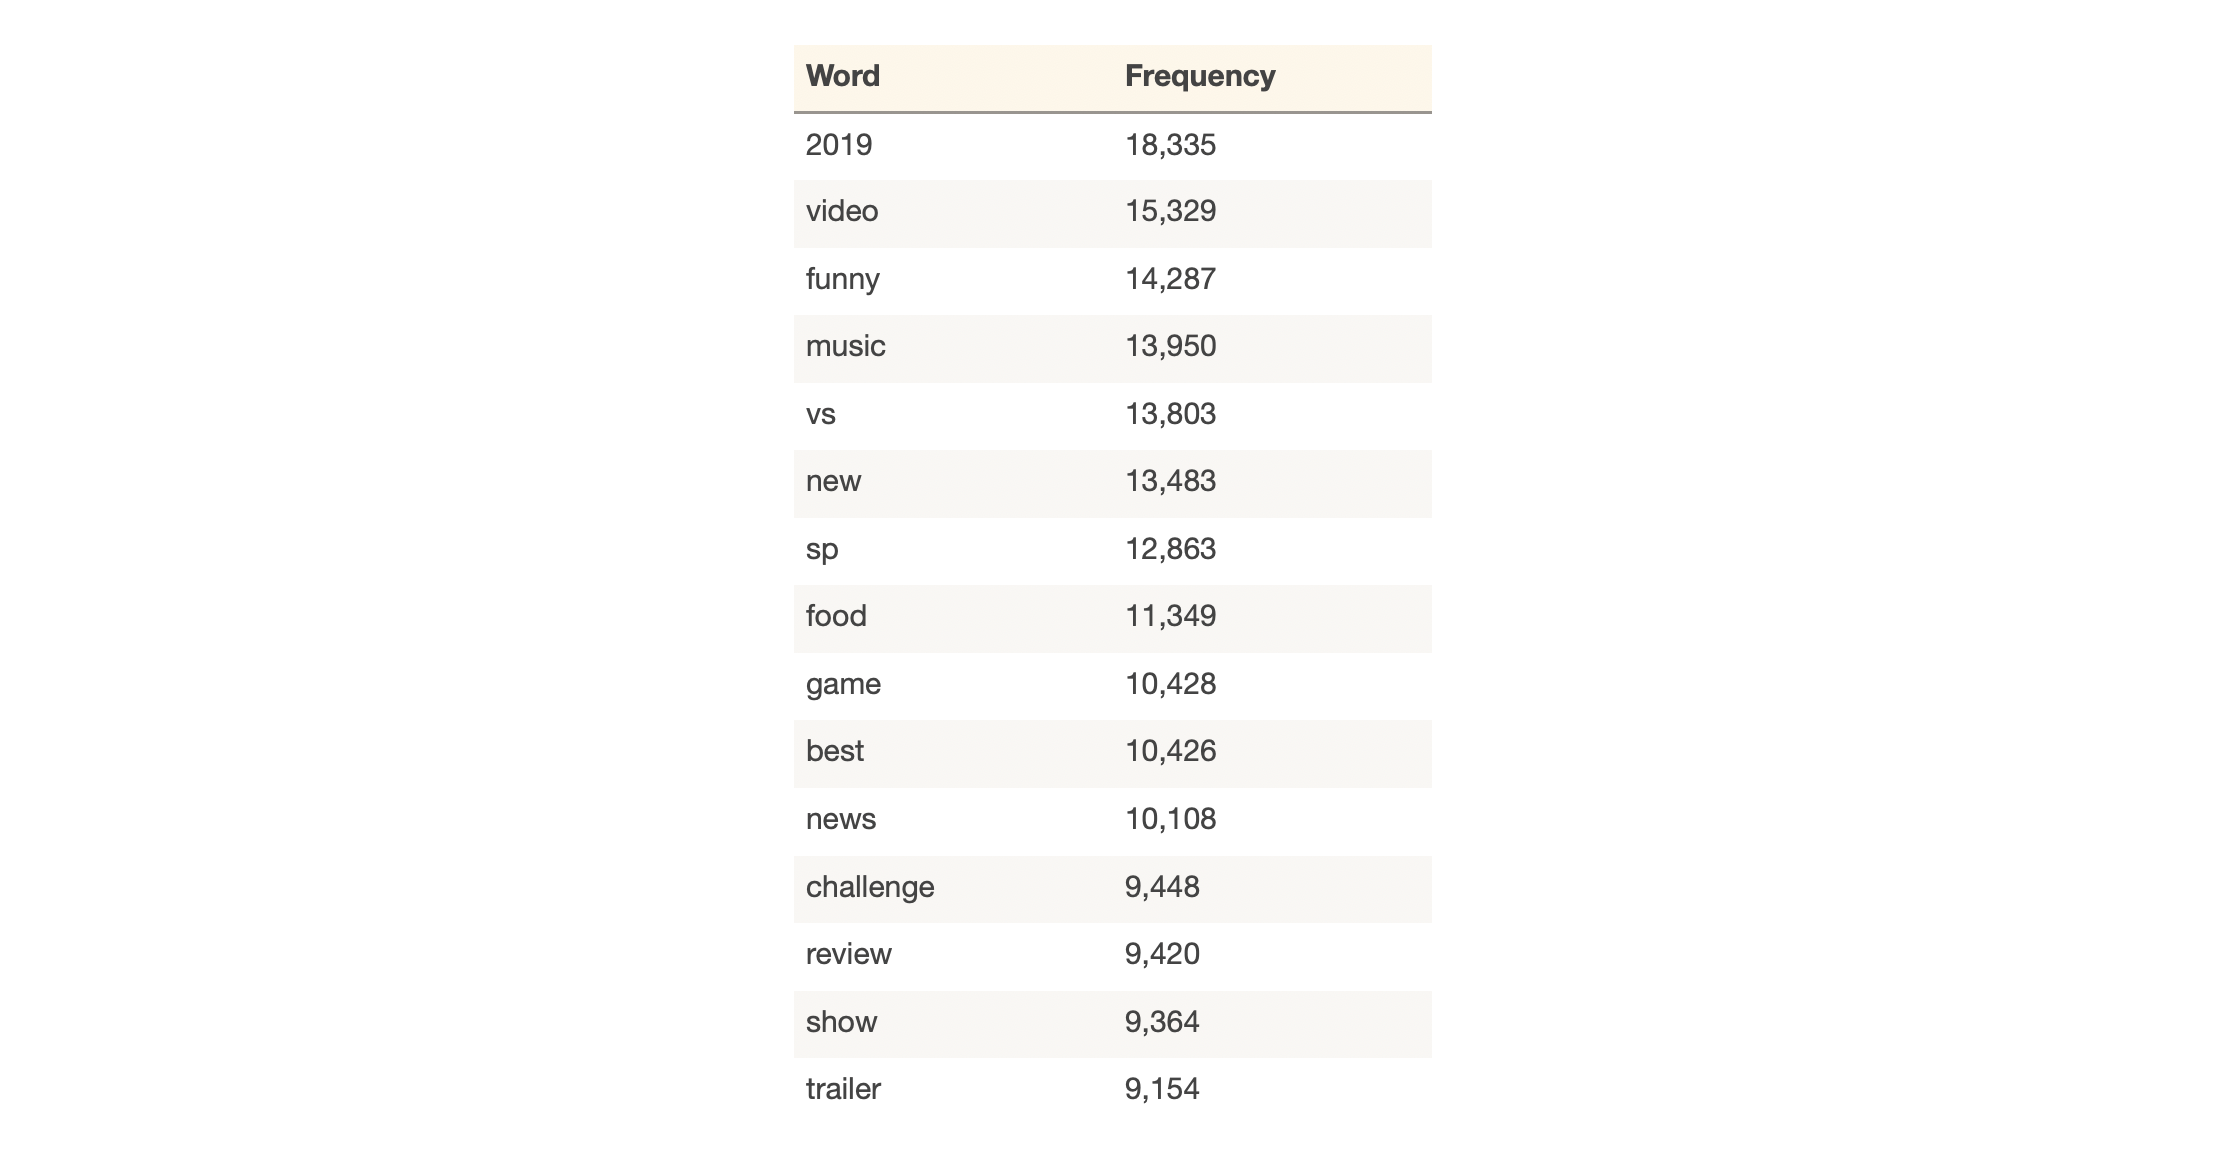
We can see that words like “video” “2019”, “funny”, etc. are more common than the other words. The table below shows the most common 15 words with their exact frequency:
After we saw the most common words in video tags, let’s now see the most common tags used in trending videos which are shown in this word cloud:
Correlations of Trending Videos
Now let’s see how different metrics of trending videos are correlated. We want to see how views are correlated with likes and how title length is correlated with views and more. Let’s visualize the correlation between different metrics by using a heatmap:
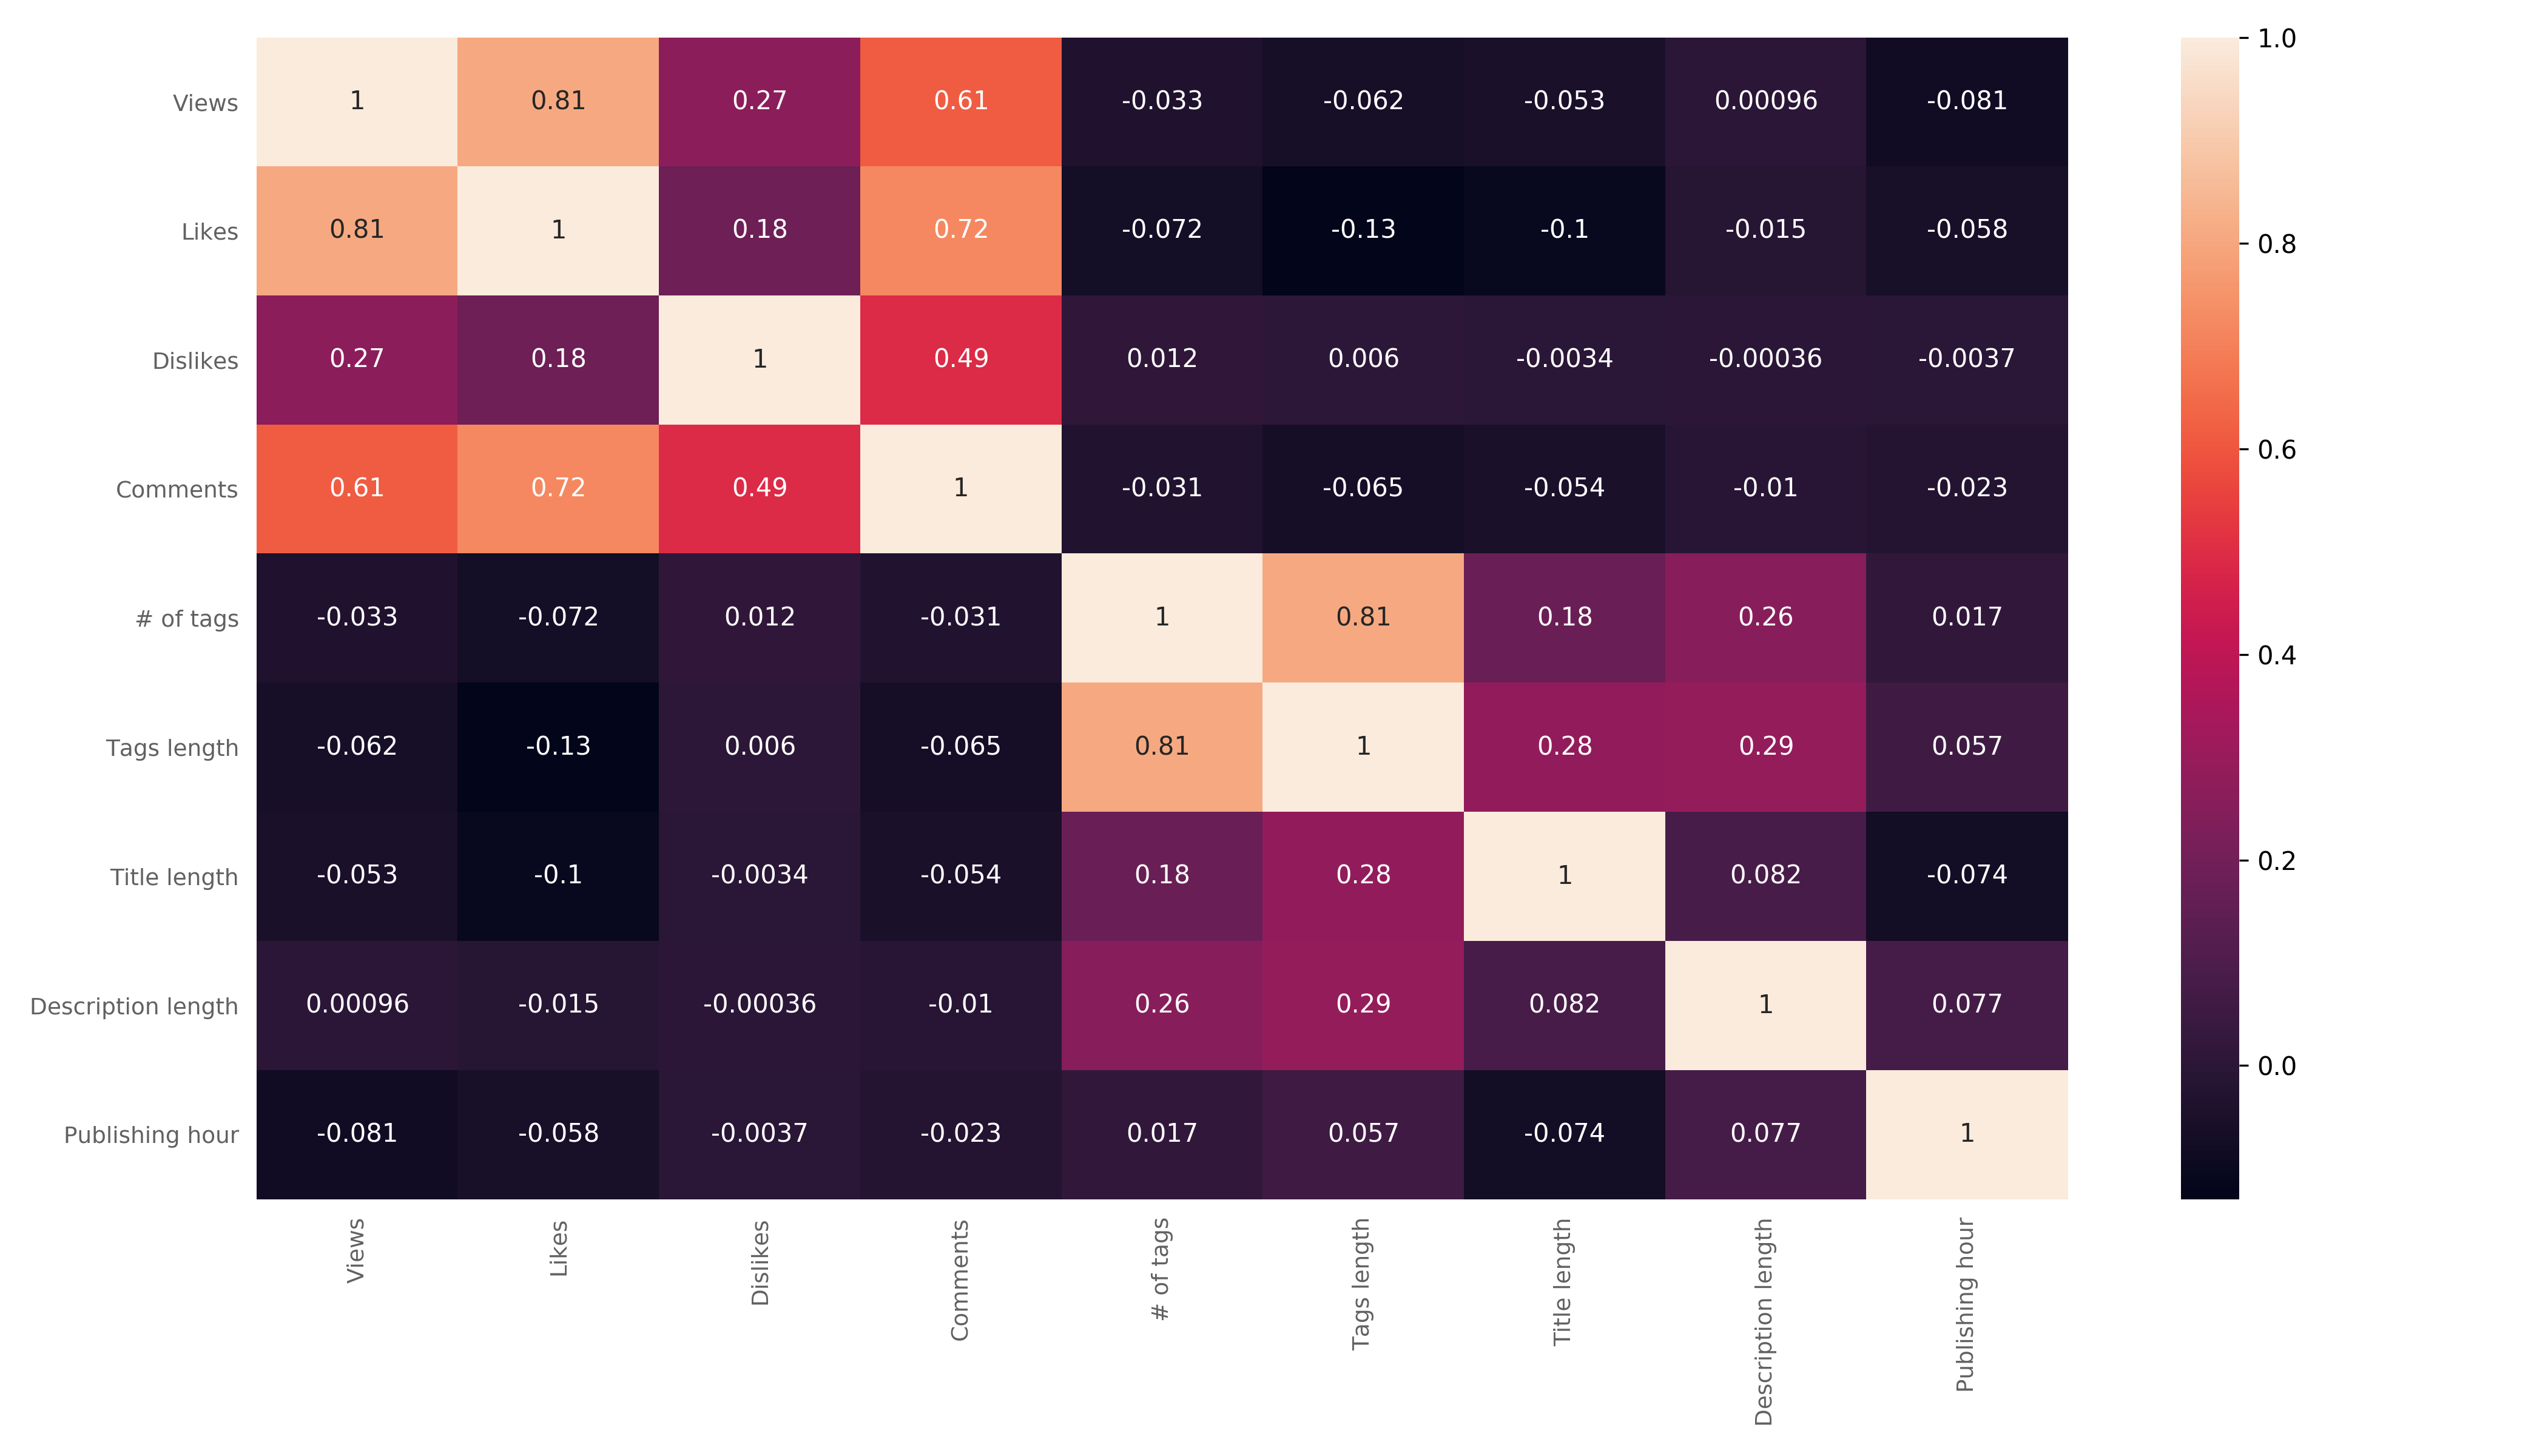
In this heatmap, lighter colors indicate higher positive correlation and darker colors indicate lower positive correlation (and sometimes negative correlation). The highest possible positive correlation is 1 and the highest possible negative correlation (which is the lowest possible positive correlation) is -1.
We can see that there is a high positive correlation (0.81) between views and likes. This means that they tend to increase together in trending videos. We can also notice a significant positive correlation (0.61) between comments and views. Also, there is a significant positive correlation between comments and likes and between comments and dislikes.
What are the Most Used Colors in Trending Videos Thumbnails?
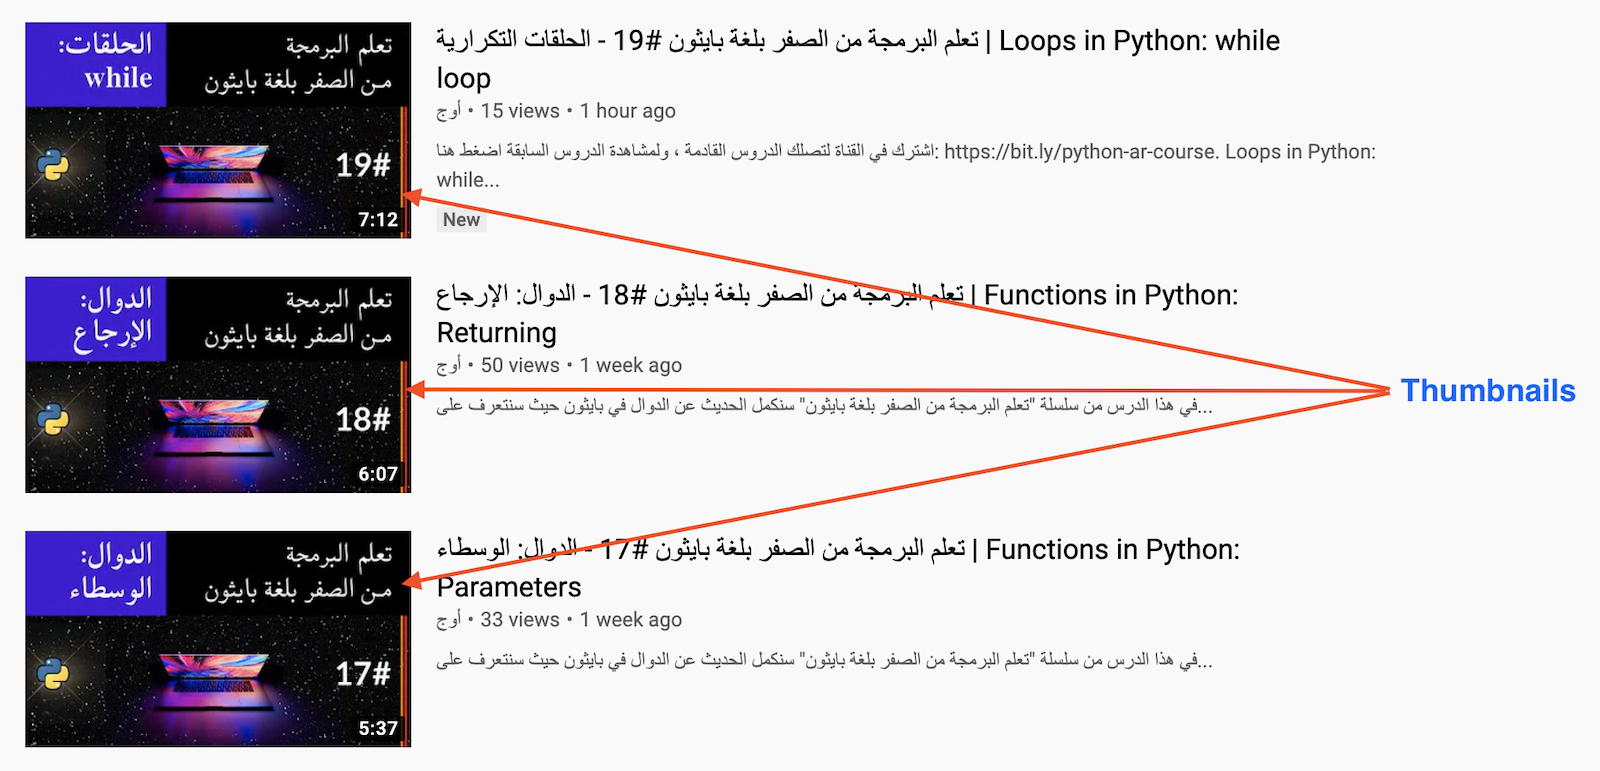
YouTube video thumbnails are the small images you see when you browse YouTube videos:
Thumbnails play now an important role in the success of a YouTube video because they affect the click-through rate (how many people click on your video when they see it). Click-through rate have a significant impact on how YouTube publishes your video. Higher click-through rate means that YouTube will show your video to more and more people. High click-through rate communicate to YouTube algorithm that your video is attractive because people are clicking on it.
So now that you know the importance of thumbnails, you should also know that many successful YouTubers spend big amounts of time trying to create the perfect thumbnail that will attract people and make them click on their videos.
And because we have all of 2019’s trending videos to analyze, let’s analyze the thumbnails of these trending videos to see what are the most used colors in those thumbnails. To find the most used colors: First, we downloaded the thumbnails of the trending videos without considering duplicates. This means that for a video that became trending more than one time (say 5 times), we downloaded one copy only of its thumbnail (not 5 copies).
After downloading the thumbnail image for each unique trending video, we counted the colors of the pixels of these thumbnails. We had 11,177 thumbnails for 11,177 unique video. Each thumbnail image size is 320 x 180 which means that each thumbnail contains 57,600 pixels. This means that all thumbnails have 643,795,200 pixels. We got the color of each pixel and then counted the number of occurrences of each color. The resulting dictionary looked like this:
{
 (255, 255, 255): 7572881,
 (254, 255, 255): 660165,
 (251, 255, 255): 280416,
 (249, 255, 255): 154100,
 (248, 255, 255): 131042,
 (255, 254, 255): 626143,
 ...
}
This dictionary contained 4,098,274 unique colors. For example, the snippet above says that 7,572,881 pixels are white. The RGB color (255, 255, 255) represents the white color. It says also that 660,165 pixels are white but their RGB representation is (254, 255, 255). The two RGB colors (255, 255, 255) and (254, 255, 255) are white; you cannot distinguish between them by your eye, but they are different in the RGB representation.
So we cannot use that dictionary to find the most used colors because if you look at the 100 most common colors in that dictionary, you will find them either white or black (different but very similar shades of white and black as we saw in the example above). Here in the following image, you see the 100 most common colors according to that dictionary:

As you can see, they are essentially white and black colors with a few grey colors.
The approach we followed then to find the most used colors was by taking the most common 10,000 colors from that dictionary then removing “duplicate” colors. For example, we kept only one black and removed all other blacks that were similar to that black.
To measure the similarity between two RGB colors, we converted the colors to Lab colors and calculated the Euclidean distance between these Lab colors. Then we considered the colors similar if the following quantity fell between 0.9 and 1.0: \(\frac{375.6-\text{Euclidean distance}}{375.6}\) where 375.6 is the maximum possible distance between two Lab colors.
After this process, we ended up with 19 colors which are the most used colors in video thumbnails. Here are the colors sorted by popularity:

What’s Inside Trending Videos Thumbnails?
Similar to what we did in the previous section when we analyzed unique trending videos thumbnails to find the most used colors, now we will analyze the thumbnails to find what is inside those thumbnails. People? Cars? Buildings?
As we saw in the previous section, we have 11,177 thumbnail images. We cannot look at them one by one to see what’s inside them. Instead, we will use artificial intelligence. In particular, we will use computer vision to see what’s inside the thumbnails. We will use an object detection algorithm that can find objects (people, cars, etc.) in images.
We used the TinyYOLOv3 algorithm. For more technical details, you can view the code by following the link in the “Code Used” section above. After running the algorithm on all the thumbnails, we got the objects that appeared in the thumbnails and the number of occurrences of each object.
The bar chart below shows the top 7 items that appeared in trending videos thumbnails the most:
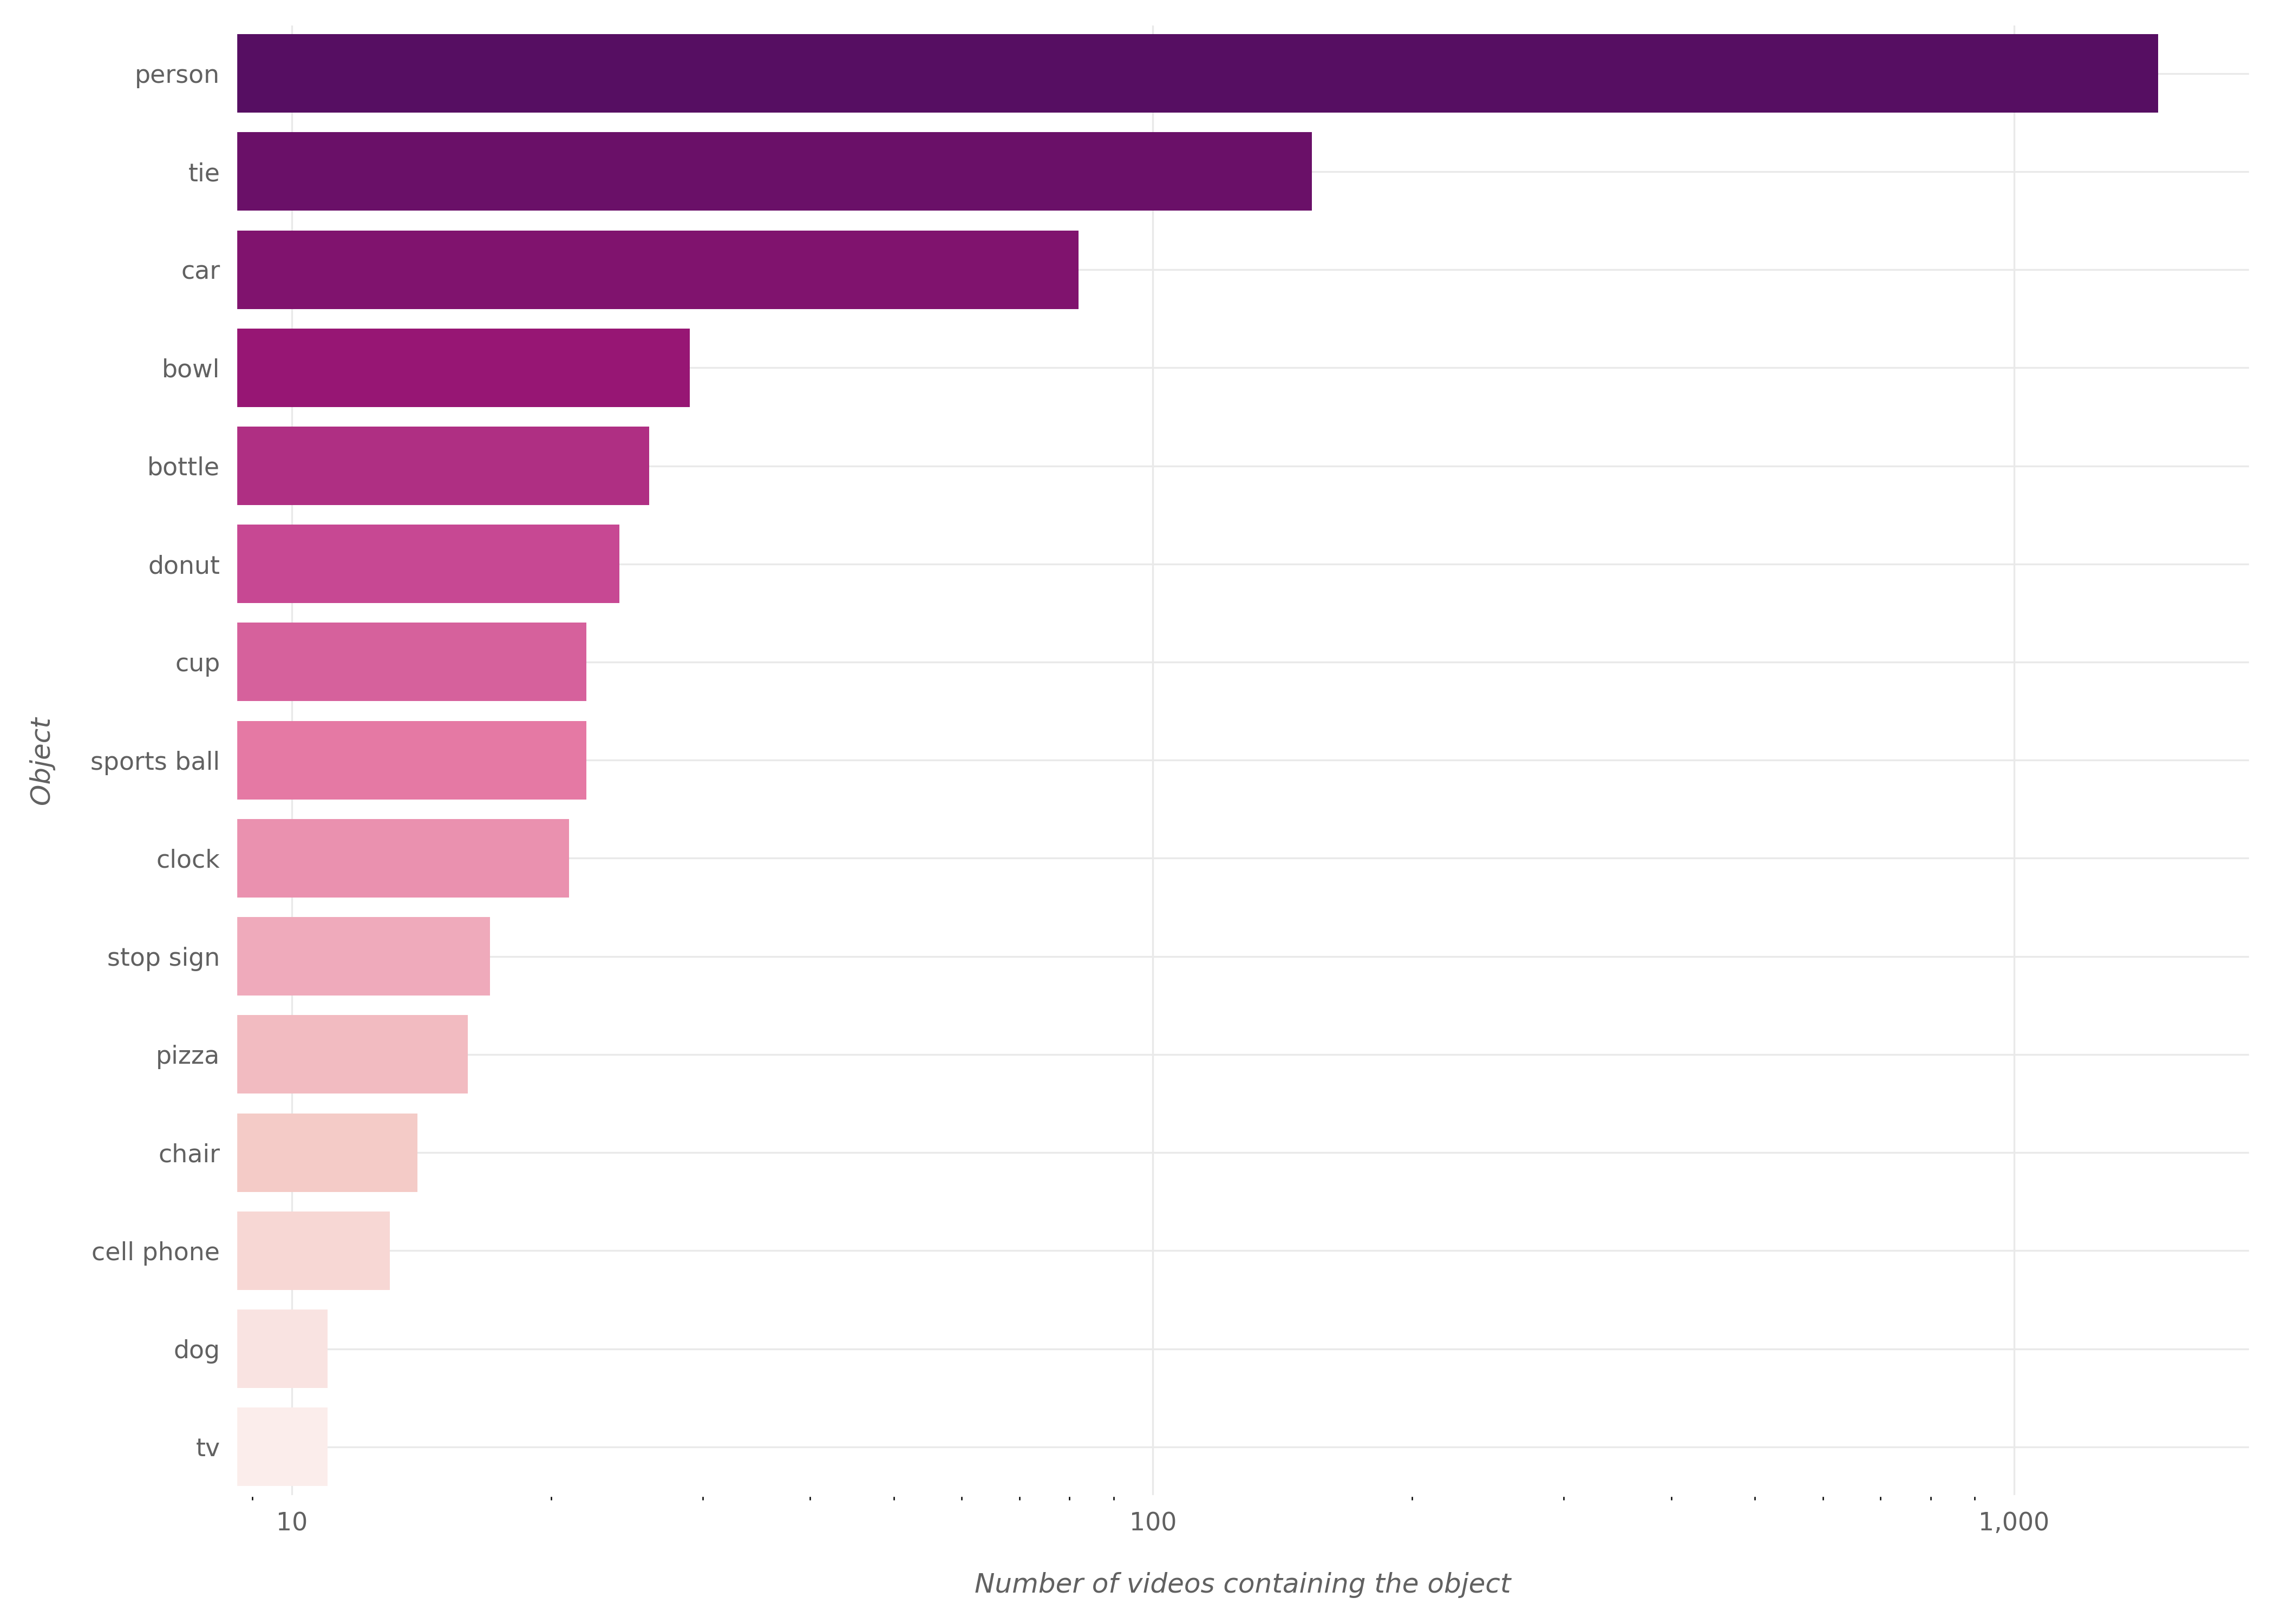
So a person image appears more than 1,000 times in trending videos thumbnails. This makes it more common than all other objects detected by the algorithm like ties, cars, bowls, bottles, etc.
As mentioned above, we used TinyYOLOv3 algorithm which is fast but may not be the most effective algorithm. We might try running a more sophisticated algorithm to see what objects it will detect.
Conclusion
In this post, we saw the results of analyzing YouTube trending videos of 2019. For me, the results were interesting and insightful. Hope they were the same for you.
If you want to download the data used in this analysis which describes 2019's trending videos in the United States, you can buy it securely on Gumroad on this link or by using the button below. Along with United States, you'll also get trending-videos data for United Kingdom, Canada, Denmark, Malaysia, Saudi Arabia, and other countries as well.